Download
1 / 8
80 likes | 258 Vues
Examining the Cluster Log. The cluster log is the best source of information that you have available to troubleshoot a cluster.

E N D
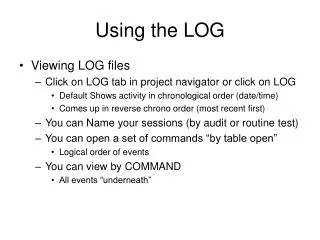
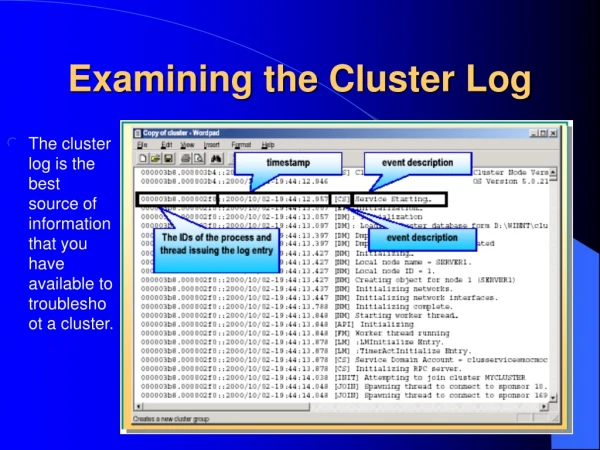
Examining the Cluster Log • The cluster log is the best source of information that you have available to troubleshoot a cluster.
The cluster log is a diagnostic log that is a more complete record of cluster activity than the Microsoft Windows 2000 Event Log. The cluster log records the Cluster service activity (Clussvc.exe and associated processes) that leads up to the events that are recorded in the event log. Although the event log can point you to a problem, the cluster log helps you to determine the source of the problem. So, for diagnosis, check the event log for general information and the cluster log for specific details about the cluster status. If you see a problem in the event log, note the timestamp and go to approximately the same timestamp on the cluster log. • The cluster log is enabled by default when you install Cluster service, but will not start logging information until after the first restart of the node. Cluster log output is written to %SystemRoot%\Cluster\Cluster.log, and you can view it with Microsoft Wordpad.
Setting the Logging Level • You can set four logging levels in the cluster log. Four logging levels are possible. The default level is two, which logs enough information necessary for normal troubleshooting. To set a different logging level, click Start, point to Settings, click Control Panel, and then double-click the System icon. Create a system environment variable under the Advanced button called ClusterLogLevel with a value of 0, 1, 2, or 3, where 0=no logging, 1=Errors only, 2=Errors and Warnings, and 3=Everything that happens.
Setting the Log File Size • The log file defaults to a maximum size of 8 megabytes (MB). When the log file size reaches 8 MB, the log file will start overwriting the data in the log file. To specify a larger file size, add the registry entry ClusterLogSize under HKEY_LOCAL_MACHINE\SYSTEM\CurrentControlSet\Services\ClusSvc\ Parameters. ClusterLogSize has a type of DWORD and it should specify the maximum size in MB for the log file. If this value is set to 0, logging is disabled.
Cluster Log Entries • There are two types of cluster log entries: Component Event Log entries and Resource dynamic-link library (DLL) log entries. Cluster service is made up of a number of components, such as the database manager and the global update manager. The cluster log records the interactions of these components, making it a powerful diagnostic tool. Because resource groups are the basic unit of failover, resource DLL entries are essential to understanding cluster activity. • The first line in the body of a typical cluster log is: • 378.32c::1999/06/09-18:00:18.874 Cluster service started - Cluster Node Version 3.2051
The main elements of this line are common to every line of the log: • The IDs of the process and thread issuing the log entry. These two IDs are concatenated, separated by a period. In the previous example, the Process ID is 378, and the Thread ID is 32c. • Timestamp. The timestamp is recorded in the following format, in Greenwich Mean Time (GMT): yyyy/mm/dd-hh:mm:ss.sss • Event description. One example of an event description would be Cluster service started.
Component Event Log Entries • In the following example, [NM] indicates the component that wrote the event to the cluster log; in this case, NM stands for node manager. • 378.380::1999/06/09-18:00:50.881 [NM] Forming cluster membership.
Resource DLL Log Entries. • The following example is a cluster log entry for a resource DLL event. This example is one of the entries from the disk arbitration process. • 15c.458::1999/06/09-18:00:47.897 Physical Disk <Disk D:>: [DISKARB] Arbitration Parameters (1 9999). • Instead of listing an abbreviated component name between the timestamp and event description as component log entries do, entries describing resource DLL events list the following information: • Resource type (Physical Disk) • Resource name (<Disk I:>) • The event description in this example is [DISKARB] Arbitration Parameters (1 9999).