Download
1 / 18
180 likes | 386 Vues
GIS In Education presented at 25th Annual STATS-DC 2012 Data Conference. GIS IN EDUCATION: FROM VISUALIZION TO DECISIONMAKING. Utilizing spatial dimension with Iowa community college data. 7/13/2012. Education among others in GIS. GIS in Transportation*.

E N D
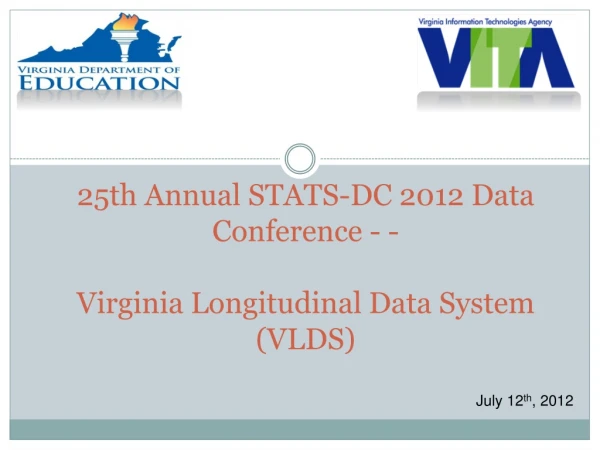
GIS In Education presented at 25th Annual STATS-DC 2012 Data Conference
GIS IN EDUCATION: FROM VISUALIZION TO DECISIONMAKING Utilizing spatial dimension with Iowa community college data 7/13/2012
Education among others in GIS GIS in Transportation* *Created with TagCrowd application at http://tagcrowd.com In transportation, GIS is not a choice: it is hard to imagine modern planning of routes, traffic distribution, road and bridges construction and maintenance without routine utilization of Geographic Information Systems. Such utilization permeates modern transportation infrastructure, and GIS data, processing, reference and reporting is usually supported by server-based solutions.
Education among others in GIS GIS in Health Care* *Created with TagCrowd application at http://tagcrowd.com Health Care utilizes GIS on a large scale for research, epidemiology, and more effective distribution of resources. Local, unit-level utilization, however, is not as developed as in transportation.
Education among others in GIS GIS in Education* *Created with TagCrowd application at http://tagcrowd.com Neither large-scale nor routine local utilization of GIS in education is a reality today. If used, GIS in education is treated predominantly as an alternative method to visualize reported data distribution, at best in the form of thematic maps. Spatial distribution of education-related data, as a powerful and unique tool, is mostly overlooked or underutilized.
Visualization through mapping: areas We need a map for the front page of our directory Map as a demonstration of distribution. A familiar geographic background is used as a frame for the demonstrated distribution: a GIS pie chart.
Visualization through mapping: area density, popular choice #1 What are the populations of CC areas and how they differ from each other? Map as a demonstration of summarized distribution. A familiar geographic background is used as a frame for the desired summaries distribution: a GIS column chart.
Visualization through mapping: dot density, not so popular Map as a demonstration of summarized distribution. A familiar geographic background is used as a frame for the desired summaries distribution: a GIS “sparkling line” chart.
Visualization through data union What percent of eligible students receive dual credit? Dual enrollment generates secondary and postsecondary credit. On a massive scale, GIS is the best visualization tool. Data relations are established through a data union in a relational database. The results are added to two or more GIS databases.
Visualization through overlaying 1964: A community college area (CCA) = an Area Education Agency (AEA); therefore, a CCA consists of the same Local School Districts (LEA) as AEA. GIS Overlaying utilizes location as the basic principle, a feature that is unique for GIS databases. It cannot be replicated with required precision in any other database.
Visualization through overlaying 2012: CCAs have not changed since 1964, AEAs have changed many times, as well as LEAs, primarily due to merging. GIS Overlaying utilizes location as the basic principle, a feature that is unique for GIS databases. It cannot be replicated with required precision in any other database.
Location as basis for reference tools What community college would you recommend and how far is it? Data is processed exclusively in a GIS application; results are used in a relational database to create a reference tool.
Location as basis for data aggregation What is educational attainment of Iowans per school or CC area? Census block data is aggregated based on census block location within school or CC area.
Penetration rate: population with high school diplomas vs. all population over 18
Location as basis for funds distribution What portion of per county- assigned funds should be allocated for a community college? GIS database allows precision in calculation of location. When borders do not coincide, only GIS can calculate precise portions of areas based on other areas.
Spatial auto distribution analysis What areas in Iowa need special attention for Adult Literacy program development? Spatial auto distribution analysis allows to establish statistical significance of polygon clusters and their clustering patterns based on any factor.
Spatial auto distribution analysis What areas in Iowa need special attention for Adult Literacy program development? Spatial auto distribution analysis allows to establish statistical relations among polygon clusters and their clustering patterns based on any factor.
Contact information Vladimir Bassis 515-281-3671 Vladimir.bassis@iowa.gov