Download
1 / 14
140 likes | 226 Vues
Formation of pn junction in deep silicon pores. By Xavier Badel, Jan Linnros, Martin Janson, John Österman Department of Microelectronics and Information Technology KTH, Stockholm. September 2002. OUTLINE. 1. Introduction 2. Experiment 3. Results 4. Summary. X. Badel, KTH, Stockholm.

E N D
Formation of pn junction in deep silicon pores By Xavier Badel, Jan Linnros, Martin Janson, John Österman Department of Microelectronics and Information Technology KTH, Stockholm September 2002
OUTLINE 1. Introduction 2. Experiment 3. Results 4. Summary X. Badel, KTH, Stockholm
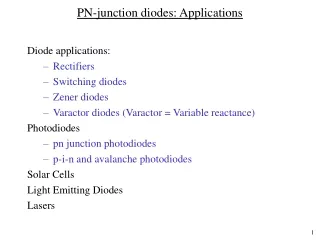
Introduction 1. Introduction Application: dental X-ray imaging ... Requirement: Spatial resolution=10LP/mm; Low X-ray dose... Detector principle: silicon based detector with CsI columns Challenging process: Form pn junctions in pore walls. X. Badel, KTH, Stockholm
Experiment: Pore formation 2. Experiment DRIE: Electrochemical Etching: - Photolithography - 10s Etching (SF6 plasma) - 10s Passivation (C4F8 plasma) - Etch rate: 2 m/min - n-type silicon (Nd = 1.1014 cm-3) - Initial patterned surface: inverted pyramids - Dissolution of n-type silicon (Nd = 1013 cm-3) involving holes and aqueous HF - Etch rate: about 0.5 m/min X. Badel, KTH, Stockholm
Experiment: Pore formation 2. Experiment Setup and other examples of electrochemical etching: X. Badel, KTH, Stockholm
Experiment: Doping methods 2. Experiment Boron diffusion from a solid source: - diffusion 1 at 1150ºC for 1h45’ : Na = 2.1020 cm-3; thickness =6 m. - diffusion 2 at 1050ºC for 1h10’ : Na = 3.1019 cm-3; thickness =2 m. LPCVD of boron doped poly-silicon: T=600ºC; P=150 mTorr; t=1h30’; Gases: SiH4 and B2H6; Na = 6.1019 cm-3; thickness = 400 nm. X. Badel, KTH, Stockholm
Experiment: Techniques for analyses 2. Experiment SEM: Scanning Electron microscopy SCM: Scanning Capacitance Microscopy 2D imaging of the doping Principle: measure dC/dV (related to the doping) via a probe scanning the surface. SSRM: Scanning Spreading Resistance Microscopy 2D imaging of the doping Principle: measure the current (related to the resistance/doping). SIMS: Secondary Ion Mass Spectrometry Dopant profiling in planar samples and through the wall thickness X. Badel, KTH, Stockholm
Profile along A SSRM AFM A 5 µm Results: Doping by diffusion 3. Results Diffusion 1: 1150ºC, 1h45’ Thickness at the pore bottoms: 3 m. Thickness on a planar wafer (SIMS): 6 m. Transport of boron down to the pore bottom may be limited. X. Badel, KTH, Stockholm
Results: Doping by diffusion 3. Results Diffusion 1: SIMS profiles at different positions along the pore depth: - No B in the substrate (profiles c, g). Walls fully doped. - [B] in pores < [B] in a planar wafer (about 5.1019 instead of 2.1020 cm-3). X. Badel, KTH, Stockholm
Results: Doping by diffusion 3. Results Diffusion 2: 1050ºC, 1h10’. SIMS profiles at different positions along the depth: - [B] in pores [B] in a planar sample; no significant variation along pore depth. - Boron atmosphere in the pores maybe more uniform at 1050ºC than at 1150ºC. - Boron layers on each side of the walls. X. Badel, KTH, Stockholm
Results: Doping by LPCVD 3. Results On a DRIE matrix: On a EE matrix, close to a defect: - Deposition on the DRIE matrix seems to be conformal. - Deposition is disturbed by defects of the walls. - SIMS measurement on a planar wafer: Na=6.1019cm-3; thickness=400 nm. X. Badel, KTH, Stockholm
Profile along A SCM AFM A Results: Doping by LPCVD 3. Results SCM at a pore bottom of a DRIE matrix after deposition: typical signature of a pn junction X. Badel, KTH, Stockholm
CsI(Tl) B: poly-Si B: poly-Si CsI(Tl) Si CsI(Tl) Si Results: Detector efficiency 3. Results “Ideal” matrix: Pore spacing = 50 µm; Pores as deep as possible; Trade-off on the wall thickness: Calculated efficiency for depth=300 µm and wall=4.1 µm : 60%. X. Badel, KTH, Stockholm
Summary 4. Summary 1. Diffusion - Transport of boron into the pores is limited at high temperature (diffusion at 1150°C for 1h45’). - Doping improved in the case of diffusion at lower temperature (1050°C for 1h10’). - p+/n/p+ structure in the walls revealed by SIMS, SEM and SSRM. 2. LPCVD - Homogeneous coverage of the pore walls. - Presence of the pn-junction revealed by SCM. 3. Next - Need of contacts on the p+ layers for I-V characterization and final detector. - Expected efficiency of about 60%. X. Badel, KTH, Stockholm