Download
1 / 4
40 likes | 81 Vues
Supplementary Figure 1. A. B. y=0.627x+2.79 R 2 =0.736. BLAST for RRM2 probes Probe(s) of RRM2 BLAST result* 201890_at 378/378(100%) 209773_s_at 375/375(100%) 36922_at 460/508 (90%)

E N D
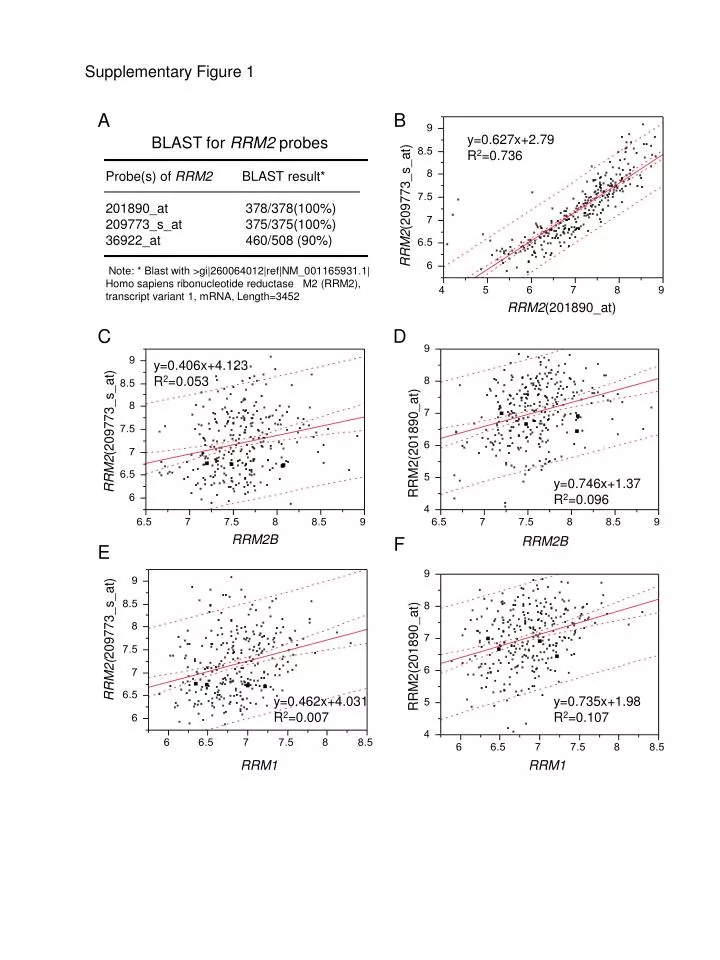
Supplementary Figure 1 A B y=0.627x+2.79 R2=0.736 BLAST for RRM2 probes Probe(s) of RRM2 BLAST result* 201890_at 378/378(100%) 209773_s_at 375/375(100%) 36922_at 460/508 (90%) Note: * Blast with >gi|260064012|ref|NM_001165931.1| Homo sapiens ribonucleotide reductase M2 (RRM2), transcript variant 1, mRNA, Length=3452 RRM2(209773_s_at) RRM2(201890_at) C D y=0.406x+4.123 R2=0.053 RRM2(209773_s_at) RRM2(201890_at) y=0.746x+1.37 R2=0.096 RRM2B F RRM2B E RRM2(209773_s_at) RRM2(201890_at) y=0.462x+4.031 R2=0.007 y=0.735x+1.98 R2=0.107 RRM1 RRM1
Supplementary Figure 2 Study Design IRB protocol (ZJU) Ten independent published microarray BC data Expo data set was excluded because of no enough survival information Data collection BLAST analysis 226 eligible BCs Huang, Bild and Sotirou data sets were excluded because of 36922_at probe 51cases excluded Ivshina, Chin, Wang, Pawitan, Desmedt, and NkI data sets Assessable 175 BCs (ZJU set) MTA construction Data normalization Optimization of IHC Data recode by quartiles Quality control RRM2 protein level (IHC) Pooled data Assessable 901BCs Survival analysis Survival analysis Stratification Analysis Conclusion
Supplementary Figure 3 B A 201890_at 201890_at progression-free survival Overall survival Desmedt set (n=198) Desmedt set(n=198) Log rank p=0.006 Log rank p=0.002 Months Months D C 209773_s_at 201890_at progression-free survival progression-free survival Ivishina set (n=249) Ivishina set (n=249) Log Rank p<0.001 Log Rank p<0.001 Months Months E F Overall survival progression-free survival Nki set(n=295) Nki set(n=295) Log Rank p<0.001 Log Rank p<0.001 Months Months G H 201890_at 201890_at Overall survival progression-free survival Pawitan set(n=159) Pawitan set(n=159) Log Rank p<0.001 Log Rank p=0.003 Months I Months J 209773_s_at 201890_at progression-free survival progression-free survival Wang set(n=286) Wang set(n=286) Log Rank p=0.001 Log Rank p=0.001 Months Months
Supplementary Figure 4 A B ER negative ER positive Overall survival Overall survival Pawitan set(n=97) Pawitan set(n=62) Log Rank p=0.001 Log Rank p=0.194 RRM2 201890_at RRM2 201890_at Months Months C D ER positive ER negative progression-free survival progression-free survival Pawitan set(n=62) Pawitan set(n=97) Log Rank p=0.711 Log Rank p=0.001 RRM2 201890_at RRM2 201890_at F Months E Months ER negative ER positive Overall survival Overall survival Pawitan set(n=97) Pawitan set(n=62) Log Rank p=0.082 Log Rank p=0.980 uPA 205479_s_at uPA 205479_s_at Months Months G H ER negative ER positive progression-free survival progression-free survival Pawitan set(n=62) Log Rank p=0.628 Pawitan set(n=97) Log Rank p=0.003 uPA 205479_s_at uPA 205479_s_at Months Months