Download
1 / 22
220 likes | 420 Vues
Single Image Super-Resolution: A Benchmark Chih-Yuan Yang 1 , Chao Ma 2 , Ming- Hsuan Yang 1 UC Merced 1 , Shanghai Jiao Tong University 2. Motivation. We would like to figure out some questions. Which is the best super-resolution algorithm? What is the influence of blur kernel width?

E N D
Single Image Super-Resolution: A BenchmarkChih-Yuan Yang1, Chao Ma2, Ming-Hsuan Yang1UC Merced1, Shanghai Jiao Tong University2
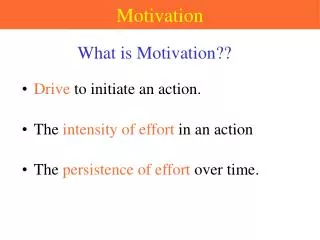
Motivation • We would like to figure out some questions. • Which is the best super-resolution algorithm? • What is the influence of blur kernel width? • What metric should be used?
Approach (step 1) We collect 11 state-of-the-art super-resolution algorithms • Bicubic interpolation • Back projection (Irani 93 : IP) • Fast image/video (Shan 07 : SLJT) • Gradient profile (Sun 08 : SSXS) • Self example (Glasner 09 : GBI) • Sparse regression (Kim 10 : KK) • Sparse representation (Yang 10 : YWHM) • Local self example (Freedman 11 : FF) • Adaptive regularization (Dong 11 : DZSW) • Simple function (Yang 13 : YY) • Anchored neighborhood regression (Timofte 13 : TSG)
Approach (step 2) We set 2 parameters • Scaling factors as 6 values • 2 3 4 5 6 8 • Blurring kernel width as 9 values • 0.4 0.6 0.8 1.0 1.2 1.4 1.6 1.8 2.0 to generate super-resolution images from 2 datasets • Berkeley segmentation dataset (200 images) • LIVE dataset (29 images)
Approach (step 3) We conduct a human subject study to collect perceptual scores and compute the ranked correlation coefficient between the perceptual scores and 8 metric indices • PSNR • Weighted PSNR • SSIM • Multi-scale SSIM • VIF (visual information fidelity) • UIQI (universal image quality index) • IFC (information fidelity criterion) • NQM (noise quality measure)
Flow chart (1) (2) Prepare ground truth images (3) (4) (5)
Flow chart (1) (2) (3) (4) Generate low-resolution images (5)
Flow chart (1) (2) (3) (4) Generate super-resolution images (5)
Flow chart (1) (2) (3) (4) (5) Compute metric indices
Flow chart (1) (2) (3) (4) (5) Compute correlation coefficients
Averaged Metric Indices s=2 s=3 s=4 s=5 s=6 s=8 LIVE dataset (29 images) BSD dataset (200 images)
the SLJT, FF, DZSW methods generate misaligned super-resolution results and low metric indices We find s=2 s=3 s=4 BSD dataset (200 images)
the best Gaussian kernel width is proportional to the scaling factor We find s=2 s=3 s=4 BSD dataset (200 images)
Reason Information remained in a low-resolution image is determined by 2 factors • blurring • subsampling When a subsampling ratio is larger, a larger kernel maximizes the remained information in low-resolution images.
all algorithms work well for smooth images but poorly for highly textured images. We find Easiest Most challenging index / PSNR
Reason • All test algorithms use appearance features and statistical approaches. • Thus they effectively handle smooth regions but difficultly reconstruct textures.
Perceptual correlations PSNR 0.4760 SSIM 0.6203 Worst: VIF 0.3874 Best: IFC 0.8434
Reason • IFC is a metric modelled by natural image priors based on high-frequency features • Our test images are all natural images • The perceptual scores are determined by the reconstructed high-frequency details
Conclusions • IFC metric shows higher correlation with perceptual scores than PSNR and SSIM • Existing algorithms have difficulty to reconstruct high-frequency textures • A scaling factor of 4 is already challenging
Future Work • How to overcome the limitation of visual features and statistical approaches? • How to evaluate super-resolution results without a ground truth image?
Code and datasets available • https://eng.ucmerced.edu/people/cyang35 • 11 algorithms on MATLAB • 4 of our implementation (IP, SSXS, GBI, FF) • 7 of original release • 400 Perceptual scores • 130,000 super-resolution images • 1M evaluation values