Download
1 / 46
470 likes | 1.03k Vues
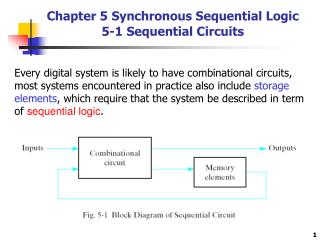
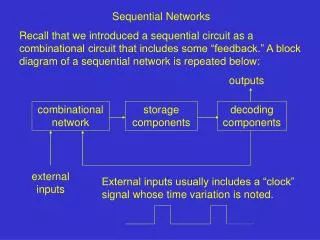
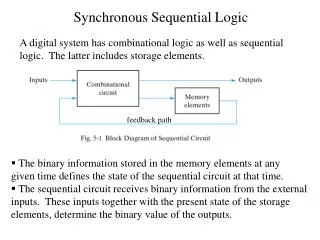
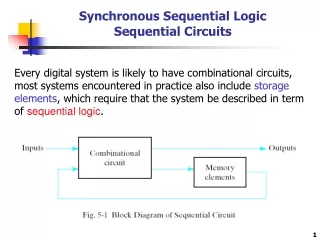
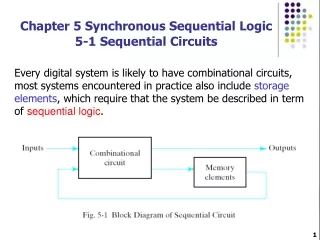
Synchronous Sequential Networks. Sequential Network Model. Clocked Synchronous Sequential Network. Mealy Model. Outputs are only a function of the external inputs and the present state Z = g(X,Q). Mealy model of a clocked synchronous sequential network. Figure 7.3. Moore Model.

E N D
Mealy Model Outputs are only a function of the external inputs and the present state Z = g(X,Q) Mealy model of a clocked synchronous sequential network. Figure 7.3
Moore Model Outputs are only a function of the present state Z = g(Q) Moore model of a clocked synchronous sequential network. Figure 7.4
Analysis of Clocked Synchronous Sequential Networks • Excitation and Output Expressions • Transition Equations • Transition Tables • Excitation Tables • State Tables • State Diagrams • Network Terminal Behavior
Logic diagram for Example 7.1 Figure 7.5
Logic diagram for Example 7.2 Figure 7.6
Excitation and Output Expressions • From example 7.1 (7.4)(7.5) (7.6) • From example 7.2 (7.7)(7.8) (7.9)(7.10) (7.11)(7.12)
Transition Equations • From example 7.1 (7.13) (7.14) • From example 7.2 (7.15) (7.16)
Transition Table Example 7.1
Transition Table Example 7.2
Excitation Table Example 7.1
Excitation Table Example 7.2
State Table Example 7.1
State Table Example 7.1
State Table Example 7.2
State diagram for Example 7.1 Figure 7.7
State diagram for Example 7.2 Figure 7.8
Timing diagram for Example 7.1 Figure 7.9
The analysis procedure Figure 7.10
Modeling Clocked Synchronous Sequential Network Behavior • State diagram • State Table • State Table Reduction: Implication table • Transition table: State Assignment • Excitation Table • Logic Diagram
The serial binary adder Figure 7.11
State diagram for a Mealy serial binary adder (a) Partial state diagram (b) Completed state diagram Figure 7.12
State diagram for a Moore serial binary adder Figure 7.13
A sequence recognizer Figure 7.14
State diagram for a sequence recognizer Figure 7.15
A 0110/1001 sequence recognizer Figure 7.16
State diagram for the final example Figure 7.17
Experiment for determining equivalent pairs of states Figure 7.18
The structure of an implication table Figure 7.19
Implication table for determining the equivalent states of Table 7.13 Figure 7.20
Implication table for determining equivalent states of the 0110/1001 sequence recognizer (a) Initial table (b) Final table Figure 7.21
Next-state and output Karnaugh maps for the transition table of Table 7.17b Figure 7.22
A state-assignment map for the state table of Table 7.17a Figure 7.23
Guidelines for Obtaining State Assignments Rule I: Two or more present states that have the same next state for a given input combination should be made adjacent Rule II: For any present state and two adjacent input combinations, the two next states should be made adjacent Rule III: Two or more present states that produce the same output symbol (0 or 1) for a given input combination should be made adjacent (only apply to one of the output symbols)
Next-state and output Karnaugh maps for the transition table of Table 7.17c Figure 7.24
Two approaches to handling unused states. (a) State table. (b) Transition table with don’t-cares for unused states. (c) Next-state maps, output map, and expressions for table of Fig. 7.25b Figure 7.25
(d) Transition table when unused states cause the network to go to state A. (e) Next-state maps, output map, and expressions for table of Fig. 7.25d Figure 7.25 cont.
Logic diagram for the excitation table of Table 7.19 Figure 7.26
Excitation and output maps for the excitation table of Table 7.20 Figure 7.27
Logic diagram for the excitation table of Table 7.20 Figure 7.28
Excitation and output maps for the Moore serial binary adder Figure 7.29
Logic diagram for the Moore serial binary adder Figure 7.30
General structure of a clocked sequential network realization using a PLD and clocked D flip-flops Figure 7.31
A clocked synchronous sequential network realization using a PLA and clocked D flip-flops Figure 7.32