Download
1 / 17
190 likes | 219 Vues
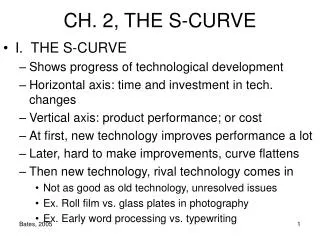
Technology S-Curve. Outlines. Abstract The usefulness of technology S-curve at the industry level The limitation of S-curve at the individual firms level Summary More discussions. What is “S-Curve”?. The uses of S-curve at the industry level :

E N D
Outlines • Abstract • The usefulness of technology S-curve at the industry level • The limitation of S-curve at the individual firms level • Summary • More discussions
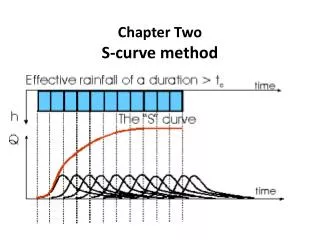
What is “S-Curve”? • The uses of S-curve at the industry level : • The description of the magnitude of improvement • The prescriptive S-Curve theory • Product performance results from: • Component technology • Architectural design S-curve can provide convincing explanations of why alternative technologies have made substantial inroads against currently dominant technology?
The Position on S-curve Corresponding to BCG Market Share HIGH LOW Product performance Growth ? ? Time or engineering effort LOW
The Limitation of S-Curve • From the point of view of a manger within a single firm, could the S-curve be the prescriptive tool for new component technology development? (at the individual firm level) • The observed maturation of a technology maybe the result, rather than the cause, of the launch of an alternative development program. • Nobody knows what the natural, physical performance limit is in complex engineered products. • The flattening of S-curve is a firm-specific, rather than uniform industry, phenomenon. • Extending the conventional technology S-curve, rather than switching S-curves? • By improving the architectural system • By applying effort to less mature element of the system
Magnetic Rigid Disk Drives • Hard Disk industry : • During 1970~1989, the improvement was steady, averaging 34% per year • With time as the horizontal metric, no S curve pattern of progress is yet apparent. • Measure total industry revenue as a proxy for engineering effort
Using S-Curve to Prescribe Development of New Component Technologies • The risk to switching to a new S-curve. • Cost more and take much longer time • When to manage the switch from one component technology to another? • Engineers sensed they were approaching the physical limit of ferrite cores before 1970. • With a process used in integrated circuit manufacturing, thin-film photolithography, they can create much smaller, more precise electromagnets on the head.
Two S-curves for Ferrite-Oxide Technologies at Fujitsu and CDC • The areal density was pushed to about triple the level at which seems initially to have planned to abandon technology. • Is 30 mbpsi Fujitsu reached in 1987 the “real” natural limit of ferrite heads and oxide disk? The observed maturation of a technology maybe the result, rather than the cause, of the launch of an alternative development program.
Points at which Thin-Film Technology was Adopted by Leading Manufacturers, Relative to the Capabilities of Ferrite-Oxide Technology at the Time of the Switch
Points at which Thin-Film Technology was Adopted by Leading Manufacturers, Relative to the Capabilities of Ferrite-Oxide Technology at the Time of the Switch • Only 5 of the 15 firms shown actually leapt above the convention technology. • Conventional technology progressed far further than anyone expected. • Different competitors switched S-curves at different points. • Little evidence show that companies switched S-curve early enjoyed attacker’s advantages.
Relationship between Order of Adoption Thin-Film Technology and Areal Density of Highest Performance 1989 Model There is no correlation between order of adoption and rank order of density Entrants enjoy no attackers advantage.
Relationship between Order of Adoption Thin-Film Technology and Areal Density of Highest Performance 1989 Model • Entrants enjoy no attackers advantage. • No systematic differences exist in how firms respond to potential maturity in component technology. (EXHIBT 8) • IBM, switching to advanced component technology • HP, relying upon • Incremental improvement in established component technologies • Refinements in system design Switching to new S-curve is not the only option.
S-curve of Architectural Innovation • Different from S-curve of component innovation • Architectural technologies indeed follow S-curve patterns! • Timely S-curve switching seems critical when confronting architectural technology change. • Not only technological dimensions but also market innovation.
Comparing Prescriptive S-curve and S-curve of Architectural Innovation
Comparing Prescriptive S-curve and S-curve of Architectural Innovation (con’t)
Conclusions • The application of S-curve at a managerial level seems to be very ambiguous. • There is more than one way to skin the cat. • There was no clear evidence of any first mover benefits or “attackers’ advantage.” • Comparing with architectural technologies. 1. Switching to new component technology S-curve early results in no competitive advantage 2. Switching to architectural S-curve enjoys powerful first-mover advantage