Download
1 / 73
740 likes | 901 Vues
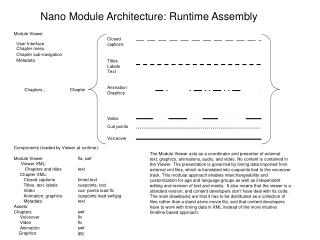
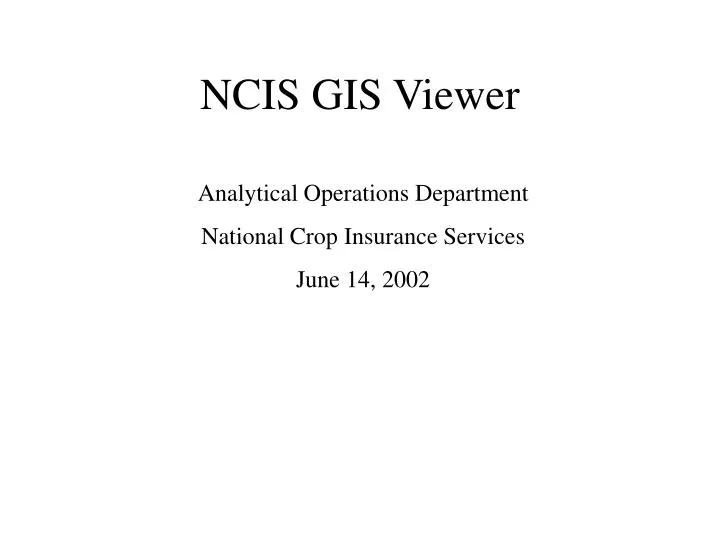
NCIS GIS Viewer. Analytical Operations Department National Crop Insurance Services June 14, 2002. HTTP://GIS.AG-RISK.ORG. Click here. User Name and Password. Hit <Enter> after Password. Pick States Mode. Click once to add state, click again to remove. Set View Mode.

E N D
NCIS GIS Viewer Analytical Operations Department National Crop Insurance Services June 14, 2002
HTTP://GIS.AG-RISK.ORG Click here
User Name and Password Hit <Enter> after Password
Pick States Mode Click once to add state, click again to remove
Set View Mode Drag a rectangle to set the view. All of this view will fit onto the paper. Afterwards, click on 2D View or 3D view to see map.
Set View Mode: Hiding of Entities (Right click anywhere on SetView screen to get this menu) Click this to hide counties by clicking on them Default
Set View Mode: Hiding of Entities We just hid all these counties (grayed out) by clicking on them. Click again to get them visible on map again.
2D View Mode (See at all the hidden counties)
3D View Mode Rotate viewing angle by dragging the cube display indicator with the mouse.
(L/S) Load & Save to NCIS Save worksheet to NCIS storage Retrieve worksheet from NCIS Save palette to NCIS storage Retrieve palette from NCIS (Use to share shading schemes between runs) Screen dump to NCIS storage Screen dump to NCIS storage (best to hide buttons first)
(L/S) Load & Save to Text Save worksheet to local text file Retrieve worksheet from text file Save palette to local text file Retrieve palette from text file For top-secret data: No NCIS storage No internet transfers.
(L/S) File Management Opens File Management Menu
(L/S) Generate one HTML Link Highlight text, then cut & paste to an email
(L/S) Generate many HTML Links Highlight text, then cut & paste to an email
Navigation Buttons: Moving ZoomIn enlarges picture; ZoomOut reduces it Arrow buttons move the view around Pan size sets the jump size in pixels for the arrow and zoom buttons. Pan cycles thru 64, 32, 16, 8, 4, 2, 1, 64,...
Navigation Buttons: Pick States Pick States button gets you “Pick States Mode”, with the map of states in the US. That is where you choose MP/CH and pick the state(s) of interest. Reminder of maps in use
Navigation Buttons: Map Types To MP/ To CH toggle button gets you into MPCI maps or Crop-Hail maps (different CRDs). This button is only active in the “Pick States” mode. • Reminder of maps in use
Navigation Buttons: Set View SetView button gets you to a screen where you define the area to be centered on the paper. Once there, you “drag a rectangle” to define a viewport (a viewing range).
(VO) Select VariablesShows if each variable is utilized.Right Click variable to change.
(VO) Changes to “Select Variables” • “Toggle All Printing Data” turns on and off data printout, “Print Data on Map” does this one variable at a time, “3D Map” chooses a variable as the 3D response variable, “Edit Variable Name” to give it a better name.
(VO) Set Focus Choose a Layer for Mouse Focus • Townships get Focus
(VO) Set Focus: Special Layers Partial TWP to Master TWP Mappings 9-TWP & 25-TWP Neighborhoods Both of the above, simultaneously
(VO) Set Focus: Special Layers County Concentric Circle Rating Districts (Ring1, Ring2) Identify a 3D-Bar Identify lots of 3D-Bars
(VO) Set Focus: Special Layers Choose this to move the map title around In conjunction with the layers ST, CRD, CNTY, TWP, Map Title. This special focus that should not be selected until you’re ready to move labels. Turn this off when done.
(VO) Set Focus: Repositioning Labelswith Drag & Drop • Under the View Options, Set Focus menu, set focus to the layer with the labels (for example TWP), and check “Enable Drag & Drop for Moving Labels”. • Using the mouse, <LeftButtonDown> inside the TWP to get focus, drag the label to a new location, and then release the mouse button (drop). • When done, go back to the Set Focus menu to uncheck “Enable Drag & Drop for Moving Labels”.
(VO) Map TitleIf multiple layers, can choose title or even not display one
(VO) Page Size (Default is 11”x17”) Don’t forget to tell your printer about this when you get around to printing the map.
(VO) Misc. Settings Moves all labels simultaneously 1000000 becomes 1,000,000 Adjusts space between data lines
(VO) Misc. Settings Automatically uses lighter text color on darker floodfill colors. Faster when shading large numbers of townships Prints data over light gray flag, very useful over patterned shading. Yipes! I lost my legend.
(VO) 3D Options Modifiable Summary of viewing angle Change bar type Change bar colors Change bar scale Reference quantities to match bar height scale to other maps
(D) Public Web Storage Use this to access a big data file on one of your local web sites. Click submit to get the data, then click OK to get rid of this menu.
(D) CHFALC: Description Appears Click OK Query was successful
(D) CHFALC: Animation …by Year success Not grayed out this time
(D) CHFALC: Animation It will sum or average, as appropriate for the variable(s) Starting Ending Arrange labels and keys before pushing this button! Beginning year of period currently on the map
(D) User File at NCIS Data file suffixes are reserved by layer: .st, .crd, .cty, .twp (choose one)