Download
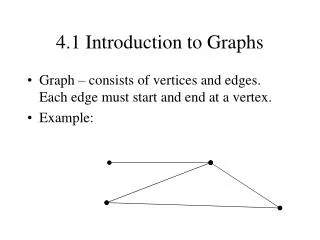
1 / 38
480 likes | 774 Vues
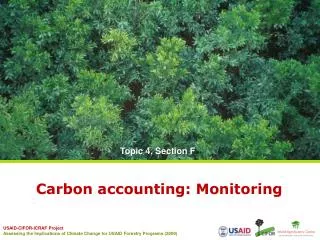
4.1. Carbon accounting: Introduction. Markku Kanninen, CIFOR. Outline. General concepts Elements of carbon accounting Approaches chosen Cost accuracy tradeoffs IPCC Good Practice Guidance. Age. Primary production of a forest. Gross Primary Production (GPP).

E N D
4.1. Carbon accounting: Introduction Markku Kanninen, CIFOR
Outline • General concepts • Elements of carbon accounting • Approaches chosen • Cost accuracy tradeoffs • IPCC Good Practice Guidance
Age Primary production of a forest Gross Primary Production(GPP) GPP / R Respiration (R) NPP Net Primary Production (NPP = GPP - R)
Carbon pool(stock) Mg C ha-1 Mg C ha-1year-1 Carbon flux (sequestration) Age Carbon pool and flux in a forest
Carbon accounting • Carbon accounting is the general term used to describe the measuring, reporting and verifying (MRV) undertaken to determine the amount of CO2 equivalent that is sequestered or the amount of carbon that is released into the atmosphere through specific activity • It also supports emissions trading and provides a basis for emission projections to assess progress towards meeting international targets
Carbon pool Carbon pool Carbonsequestration Carbonemission Basic terminology Carbon flux Atmosphere Forest Atmosphere Forest
Elements of an accounting system • Forest carbon C = A * DC = forest carbon pool (Mg)A = forest area (ha)D = carbon density per unit area (Mg C ha-1) • Carbon accounting system has to be able to monitor changes in these two main variables • Area of forest (A) and changes in the area (e.g. due to deforestation or afforestation) • Carbon stock density per unit area (D) and changes in it(e.g. due to forest management, degradation) • Monitoring of these variables • Remote sensing technologies combined with ground measurements play a key role in measuring and monitoring
0 10 Canopy Cover 30 100 Definition of forest (FAO) • Minimum area of land 0.5 ha • Minimum canopy cover of 10% • Minimum tree height 5 m Source: FAO 2007
0 10 Canopy Cover 30 100 Definition of forest in CDM • Host country must define a forest within the following guidelines: • Minimum land area between 0.05 and 1.0 hectare • Minimum tree crown cover between 10 and 30% • Minimum tree height between 2 and 5 m • Values once chosen must remain fixed
1990 Afforestation and reforestation in CDM Afforestation Reforestation 50 years
Deforestation and degradation Land use change? Yes Deforestation No Loss of C? Degradation Yes
Carbon pools (IPCC GPG) • The IPCC GPG (2003) - five carbon pools: aboveground biomass, belowground biomass, litter, dead wood, and soil organic carbon Trees Above-ground biomass Other above-ground biomass Dead wood Litter Below-ground biomass Soil carbon
Carbon pools (IPCC GPG) Source: IPCC GPG 2003
Levels of carbon accounting • National level carbon accounting • Annex I Parties of the Kyoto Protocol • Under discussion for REDD in the post 2012 climate agreement • Project-level carbon accounting • CDM afforestation/reforestation projects • Project in voluntary carbon markets • Nested approach • Combination of national and sub-national (e.g. state, province, project) level carbon accounting • Proposal for an optional approach in REDD
Monitoring forest areas and area changes Two main approaches: • Wall-to-wall mapping • Sampling Example of systematic sampling Example of annual wall-to-wall mapping (PRODES) in Amazonia Example of stratified sampling Source: COFC-GOLD 2008
Using remote sensing • Measure tree height and crown diameter from remote sensing imagery (Ikonos or higher resolution) • Construct allometric models between tree biomass and crown diameter for calculations
Monitoring carbon pools Example of fate of carbon pools in an agroforestry plantation Example of fate of carbon pools following deforestation Sources: Masera et al. 2003; GOFC-GOLD 2008
Two means (time 1 and time 2) RME = Reliable Minimum Estimate When number of observations (plots) increases -> variability of the data (standard deviation) decreases Detecting the difference • RME 1 is smaller than RME 2 Standard deviation explained A data set with a mean of 50 (shown in blue) and a standard deviation (σ) of 20. Source: IPCC GPG 2003
Relationship between precision level and number of plots • The higher the precision level the higher the number of field measurement plots required Source: IPCC GPG 2003
Cost of precision for monitoring (Noel Kempff project, Bolivia) Total project area: 640 000 ha
What do we need to have? • Baseline methodology (reference levels) • Project boundary (if project-level accounting) • Additionality • Baseline net greenhouse gas removals by sinks • Leakage, risks, uncertainties • Monitoring methodology • Cost-effective measuring and monitoring protocols • Quality assurance and control • Baseline net greenhouse gas removals by sinks • Actual net greenhouse gas removals by sinks
Real Verifiable Long-term Additional Certified Risks, uncertainties, leakage Measuring & monitoring plan Non-permanence Baseline/reference level Standards for certification Issues to be taken into account If the emission reductions have to be: Issues that have to taken into account – or provide information on:
IPCC Good Practice Guidance for Land Use, Land-Use Change and Forestry (2003) • Supplementary methods and good practice guidance • Estimating, measuring, monitoring and reporting on carbon stock changes and greenhouse gas emissions from LULUCF activities • Articles 3, 6 and 12 of the Kyoto Protocol http://www.ipcc.ch/ or http://www.ipcc-nggip.iges.or.jp/public/gpglulucf/gpglulucf_contents.htm
Additionality • Environmental (climate) • Benefits in terms of GHG emission reductions = Project – baseline > 0 • Policies and programs • Why we need CDM or REDD to make this happen? • Existing plans and programs and policies • Investment/financial • Not from “traditional” development assistance (CDM)
Additionality of emission reductions Emissions Project Base line Projected emissions (project case) Time
Reforestation(CDM project) Additionality Scenario 2 Abandonedpasture(Baseline 2) Additionality Scenario 1 Pasture Pasture continues (Baseline 1) 2002 2012 Additionality – example:reforestation of abandoned pasture
Baseline • What would happen without the project? • The scenario of anthropogenic emissions by sources or anthropogenic removals by sinks of GHG’s that would occur in the absence of the proposed project • The sum of the changes in carbon stocks in the carbon pools within the project boundary that would have occurred in the absence of the project activity (CDM or REDD)
Total C stock (past and projected) in300 000 ha forest area of Chiapas, Mexico 70 Low (0.4% / year) 37.4 Carbon pool (Mt C) 14 High (2.3% / year) 1974 1996 2045 Year Scenarios using three levels of rate of deforestation (as per cent of area deforested) - low – mean - high 63.6 1990 1984 Mean (1.6% / year) 20 Actual Projected Data: Landsat MSS (Source: Brown et al., 2007)
Non-forest Forest Mapping the past land-use change Example: Purépecha, Michoacán, Mexico Time 1 1993 Time 2 2000
Pine Pine-oak Agriculture No Spruce Scrub land Fruit crops Plantedforest Dry forest Pasture Lakes Agriculture Urban Total Oak forest forest irrigated vegetation forest forest Oak 5,470 3 86 2,014 1,697 0 259 153 0 0 2,286 6 16 0 11,988 forest Pasture 1 9,198 829 65 37 2 4,512 81 341 0 4,618 6 0 1 19,691 Scrub land 137 241 2,951 148 45 3 877 16 6 29 3,695 56 0 60 8,264 Pine forest 1,104 71 197 58,454 9,905 0 1,580 5,856 0 12 25,419 63 323 0 102,982 Pine-oakforest 1,507 21 44 6,912 62,779 0 1,334 2,429 33 24 12,480 6 174 0 87,745 0 51 10 7 13 11,740 149 1 0 4 73 0 1 0 12,050 Lakes Agriculture 616 6,908 3,577 2,161 3,556 53 115,263 10,133 2,148 41 47,669 1,102 150 189 193,566 Fruit crops 115 80 5 2,261 630 23 402 22,069 28 23 2,176 336 1 0 28,149 Agricultureirrigated 0 995 15 1,018 577 3 1,917 507 12,646 0 3,884 288 4 12 21,866 No veg. 72 1 15 261 621 0 558 535 0 3,481 428 0 5 0 5,978 Dry forest 569 6,103 2,732 14,640 6,366 66 7,647 9,566 1,077 139 90,492 219 5 99 139,722 Urban 0 74 11 43 2 0 117 48 19 0 111 7,405 0 8 7,840 Spruce for. 18 0 2 173 296 0 12 17 0 0 500 0 6,707 0 7,725 Planted for. 0 1 11 8 2 0 37 0 1 1 107 12 0 400 580 Total 9,609 23,748 10,484 88,165 86,527 11,890 134,663 51,413 16,300 3,755 193,940 9,500 7,384 768 648,147 Land-use change matrix Land-use in 2000 Land-use in 1993 Figures in 1000 Has
Land-use change matrix Figures in 1000 Has Land-use in 2000 Land-use in 1993
Forest Non-forest Deforestation Protected areas No data Simulation of deforestation 2000-2025 2000 2005 2010 2015 2020 2025 Purépecha, Michoacán, Mexico
Risks and uncertainties • Risks: loss of C due to unexpected occurrence of • Fires, pest and disease outbreaks • Hurricanes, earthquakes, flooding • Human-induced activities • Uncertainties: • Errors in estimation/measurement of C stocks • Errors in the construction of the baseline • How to handle risks and errors? • Discounting during project validation and certification • Better methods for their prediction
Leakage • The increase in greenhouse gas emissions elsewhere • Occurs outside the boundary of project activity under the CDM or REDD • Is measurable and attributable to the project activity • Example • Increased deforestation outside the province X caused by relocation of human settlements due to REDD activity in the province X • Methods for estimation of leakage • Discounting of the credits (in projects) • National level (REDD) accounting eliminates leakage
References • Brown, S. 1997 Estimating biomass and biomass change of tropical forests: a primer. FAO Forestry Paper no. 134. • Brown, S. 2002 Measuring carbon in forests: current status and futurechallenges Environ. Pollut. 116:363-72. • Brown, S. and Gaston, G. 1995 Use of forest inventories and geographic information systems to estimate biomass density of tropical forests: applications to tropical Africa. Environ. Monit. Assess. 38:157-68. • Brown, S., Hall, M., Andrasko, K., Ruiz, F., Marzoli, W., Guerrero, G., Masera, O., Dushku, A., de Jong, B. and Cornell, J. 2007 Baselines for land-use change in the tropics: application to avoided deforestation projects. Mitigation and Adaptation Strategies for Global Change 12:1001-26. • GOFC-GOLD. 2008 Reducing Greenhouse Gas Emissions from Deforestation and Degradation in Developing Countries: A Sourcebook of Methods and Procedures for Monitoring, Measuring and Reporting. Ch. 6. GOFC-GOLD Report version COP13-2. GOFC-GOLD Project Office, Natural Resources Canada, Alberta, Canada. • Masera, O., Garza-Caligaris, J.F., Kanninen, M., Karjalainen, T., Nabuurs, G., Pussinen, A., de Jong, B.J. and Mohren, G.M.J. 2003 Modelling carbon sequestration in afforestation and forest management projects: the CO2FIX V 2.0 approach. Ecological Modelling 164: 77-199. • Pearson, T., Walker, S. and Brown, S. 2005 Sourcebook for land use, land-use change and forestry projects. Winrock International and the BioCarbon Fund of the World Bank. 57p. • Penman, J. et al. 2003 Good practice guidance for land use, land-use change and forestry. IPCC National Greenhouse Gas Inventories Program and Institute for Global Environmental Strategies, Kanagawa, Japan. http://www.ipcc-nggip.iges.or.jp/public/gpglulucf/gpglulucf.htm