Download
1 / 26
260 likes | 264 Vues
This study explores the coupled atmosphere-ocean modeling system and its sensitivities to initialization and atmospheric forcing in the New Jersey Coastal Zone. The findings highlight the benefits of continuous assimilation of CODAR data for more accurate forecasts.

E N D
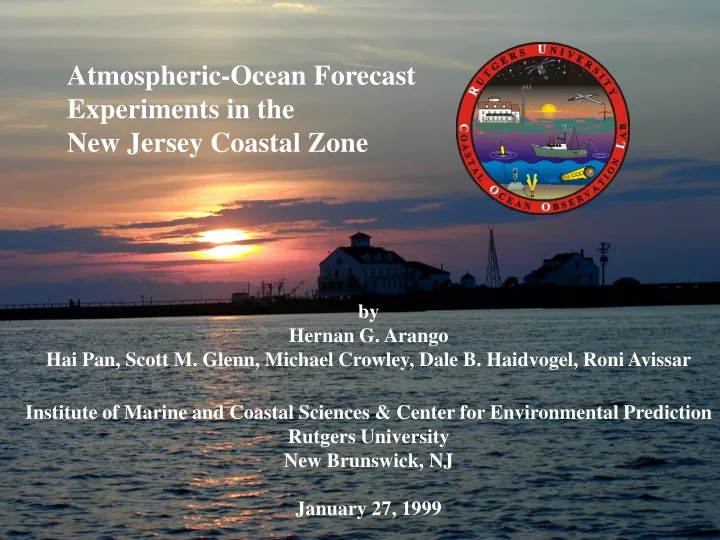
Atmospheric-Ocean Forecast Experiments in the New Jersey Coastal Zone • by • Hernan G. Arango • Hai Pan, Scott M. Glenn, Michael Crowley, Dale B. Haidvogel, Roni Avissar • Institute of Marine and Coastal Sciences & Center for Environmental Prediction • Rutgers University • New Brunswick, NJ • January 27, 1999
Outline • Coupled atmosphere-ocean modeling system • Forecast cycles and ensemble • Sensitivities to initialization and atmospheric forcing • Analysis of 1999 upwelling event
LEO meters ROMS Bathymetry
LEO meters ROMS Bathymetry
meters Node A ROMS Bathymetry
Initialization • Continuous initialization from previous forecasting cycle ensemble • MODAS (Bob Rhodes and Dan Fox, NRL).
Initialization • Continuous initialization from previous forecasting cycle ensemble • MODAS (Bob Rhodes and Dan Fox, NRL). • Forcing • RAMS surface winds and fluxes every half-hour • NOGAPS/COAMPS surface winds and fluxes every twelve hours • One-way coupling via atmospheric boundary layer • Wind-induced waves from WAM and LEO-15 node • Zero fresh water flux (E-P) • No Tides
Navy Products NOAA & Rutgers Global Atmospheric Forecasts NOGAPS NCEP I.C. B.C. I.C. B.C. Local Atmospheric Forecasts COAMPS 27 km 6 hours RAMS 4 km 30 min Atm. Forcing Atm. Forcing Ocean Models ROMS PBL SBL BBL WBL MODAS (POM) I.C. Waves WAM Wave Models
Boundary Layer Schematic O H H L o n g w a v e Shortwave O E v a p H H
Initialization • Continuous initialization from previous forecasting cycle ensemble • MODAS • Forcing • RAMS surface winds and fluxes every half-hour • NOGAPS/COAMPS surface winds and fluxes every twelve hours • One-way coupling via atmospheric boundary layer • Wind-induced waves from LEO-15 node • Zero fresh water flux (E-P) • No Tides • Assimilation • Melding of SST and hydrography (OI) once a day • Surface currents from CODAR (nudging)
Ocean-Atmosphere • Forecasting Cycles
Forecast Cycle - July, 1999 Ship/AUV Data Ship/AUV Data Ship/AUV Data Ship/AUV Data Ship/AUV Data Ship/AUV Data Ship/AUV Data Ship/AUV Data Ship/AUV Data Ship/AUV Data Ship/AUV Data Ship/AUV Data Ship/AUV Data Sun. Mon. Tues. Wed. Thur. Fri. Sat. Forecast Day 4 Forecast Day 4 Day 1 Forecast Day 2 Forecast Day 3 D4 Day 1 Forecast Day 2 Forecast Day 3 D4 Day 1 Forecast Day 2 Forecast Day 3 Day 1 Forecast Day 2 Forecast Day 3 Rmt / Node Rmt / Node Remote Sensing / Node Data Remote Sensing / Node Data Remote Sensing / Node Data Remote Sensing / Node Data Model Run Model Run Model Run Model Run Nwcst Day 0 Day -2 Day -1 Nwcst Day 0 Assim Day -3 Day -2 Day -1 Nwcst Day 0 Day -2 Day -1 Nwcst Day 0 Assim Day -3 Day -2 Day -1 Sun. Mon. Tues. Wed. Thur. Fri. Sat. 4 5 6 7 8 9 10 Day 1 Forecast Day 2 Forecast Day 3 Remote Sensing / Node Data Remote Sensing / Node Data Model Run Day -2 Day -1 Nwcst Day 0 Assim Day -3 Day -2 Day -1 11 12 13 14 15 16 17 18 19 20 21 22 23 24 25 26 27 28 29 30 31 Forecast Day 4 Day 1 Forecast Day 2 Forecast Day 3 D4 Day 1 Forecast Day 2 Forecast Day 3 Rmt / Node Remote Sensing / Node Data Remote Sensing / Node Data Model Run Model Run Ship/AUV Data Ship/AUV Data Nwcst day 0 Day -2 Day -1 Nwcst Day 0
Sensitivity to • Initialization and Forcing
July 14, 1999 - 15:00 GMT Temperature Cross Sections 25 23 21 19 17 15 13 11 0 5 10 15 20 25 Temp (oC) Depth (m) Observations 0 5 10 15 20 Distance (km) 25 23 21 19 17 15 13 11 25 23 21 19 17 15 13 11 0 5 10 15 20 25 0 5 10 15 20 25 Depth (m) Depth (m) Temp (oC) Temp (oC) RAMS Forcing COAMPS Forcing 0 5 10 15 20 0 5 10 15 20 Distance (km) Distance (km)
AVHRR SST July 28, 1999 08:00 GMT COAMPS Forcing July 28, 1999 21:00 GMT 28 26 24 22 20 18 16 14 12 10 39:42N 39:40N 39:30N 39:30N 39:20N 39:18N 39:10N 74:24W 74:12W 74:00W 73:48W 74:20W 74:10W 74:00W 73:50W Surface Currents and Temperature (oC)
AVHRR SST July 28, 1999 08:00 GMT MODAS/RAMS Forcing July 28, 1999 21:00 GMT 28 26 24 22 20 18 16 14 12 10 39:42N 39:40N 39:30N 39:30N 39:20N 39:18N 39:10N 74:24W 74:12W 74:00W 73:48W 74:20W 74:10W 74:00W 73:50W Surface Currents and Temperature (oC)
AVHRR SST July 28, 1999 08:00 GMT RAMS Forcing July 28, 1999 21:00 GMT 28 26 24 22 20 18 16 14 12 10 39:40N 39:40N 39:30N 39:30N 39:20N 39:20N 39:10N 39:10N 74:20W 74:10W 74:00W 73:50W 74:20W 74:10W 74:00W 73:50W Surface Currents and Temperature (oC)
Upper Layer Along Shore, Time-integrated Transport (July, 1999) 104*m2
Bottom Layer Along Shore, Time-integrated Transport (July, 1999) 104*m2
9 7 5 3 1 Ekman Pumping (m/day) Cross-Shelf Time Integrated Transport 20 15 10 5 0 -5 Utop Ubot Tauy offshore 104 * m2 39:42N onshore 26 27 28 29 30 31 39:30N Along-Shelf Time Integrated Transport 25 15 5 -5 Vtop Vbot Taux North 39:18N 104 * m2 74:24W 74:12W 74:00W 73:48W South July 28, 1999 26 27 28 29 30 31
Conclusions • Initial conditions generated by continuous assimilation of CODAR produce better forecasts than cold starts using MODAS without CODAR assimilation. • High spatial and temporal resolution RAMS produced better ocean forecasts than courser COAMPS forcing. • Offshore of the the upwelling center: • Forecasts indicate the upper layer offshore transport exceeds • the Ekman transport. • The bottom layer onshore transport does not fully compensate. • Upwelling flow is 3-D with cold bottom water flowing in from the North. • There is a need for a coupled, high-resolution ocean-atmosphere system that can be run locally in forecast mode.
Future System Improvements • Estuaries • River runoff (Signell & Hetland). • Tides (Bogden & Chant). • ESSE assimilation (Lermusiaux). • Coupled bio-optical model (EcomSim - Bisset). • Sediment resuspension and transport (Styles & Glenn).


![Ants [by Amanda Crowley]](https://cdn2.slideserve.com/4463538/ants-by-amanda-crowley-dt.jpg)