Download
1 / 29
290 likes | 440 Vues
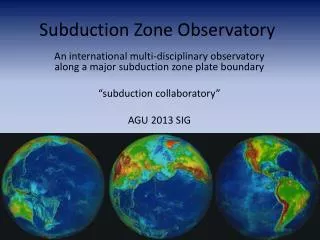
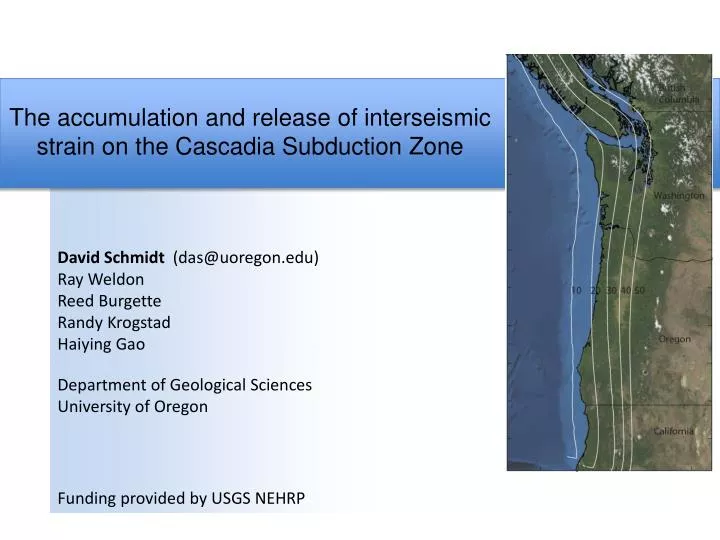
The accumulation and release of interseismic strain on the Cascadia Subduction Zone. David Schmidt (das@uoregon.edu) Ray Weldon Reed Burgette Randy Krogstad Haiying Gao. Department of Geological Sciences University of Oregon. Funding provided by USGS NEHRP. Talk Overview

E N D
The accumulation and release of interseismic strain on the Cascadia Subduction Zone David Schmidt (das@uoregon.edu) Ray Weldon Reed Burgette Randy Krogstad Haiying Gao Department of Geological Sciences University of Oregon Funding provided by USGS NEHRP
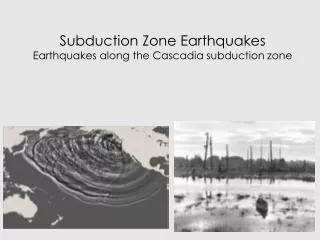
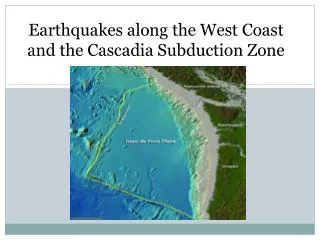
Talk Overview • Sources of deformation on the plate interface • Making observations of deformation • Strain accumulation • Transient release of strain (Safer and Tobin, 2011) Graphic: Hyndman & Wang (1995)
Deformation in Cascadia Coast moves east and up between earthquakes. Coast moves west and down during earthquakes. Graphic: Leonard et al. (2009)
Differenced Tidal Records, CC-AS 0.25 Sea level (m) 0 -0.25 1940 1960 1980 2000 year Observations of Interseismic Deformation • Uplift rates from spirit leveling • Observations span 1930-present. • Uplift referenced to eustatic sea level. • 1- uncertainties ~0.5 mm/yr. -3 -2 -1 0 1 2 3 4 Uplift (mm/yr) (Burgette et al., JGR, 2009)
Observations of Interseismic Deformation • Uplift rates from spirit leveling • Observations span 1930-present. • Uplift referenced to eustatic sea level. • 1- uncertainties ~0.5 mm/yr. Uplift rate (mm/yr) West East -3 -2 -1 0 1 2 3 4 East from 20-km-depth slab contour (km) Uplift (mm/yr) (Burgette et al., JGR, 2009)
Horizontal Observations of Interseismic Deformation • Horizontal GPS Velocities from PBO data products and McCaffrey et al. (2007). • Limited to stations with data for > 2 years
Horizontal Observations of Interseismic Deformation Rotation of Oregon Removed (pole of McCaffrey et al., 2007) Original Velocity Field
Horizontal Observations of Interseismic Deformation 0 50 100 150 Rotation of Oregon Removed (pole of McCaffrey et al., 2007) Original Velocity Field Compressional Strain Rate (nanostrain/yr)
Modeling Methodology • Fixed parameters • Defined Convergence rate • JDF-OCR Euler pole for the southern end (Wells & Simpson, 2001). • JDF-NA Euler pole for the northern end (Mazzotti et al., 2003) • Plate geometry of McCrory et al. (2006). • Upper edge of locked zone begins at trench.
Down-Dip Locking 4 3 Slip Rate Deficit (cm/yr) 2 1 0 5 15 25 Depth of Slab (km) Modeling Methodology • Fixed parameters • Defined Convergence rate • JDF-OCR Euler pole for the southern end (Wells & Simpson, 2001). • JDF-NA Euler pole for the northern end (Mazzotti et al., 2003) • Plate geometry of McCrory et al. (2006). • Upper edge of locked zone begins at trench. • Backslip calculation (Savage, 1983). • Free parameters • Depth of locking; Depth of transition zone. • Optimization by grid search of parameter space • Step 1: Depths constrained along west-east • leveling profiles (fit both uplift and strain). • Step 2: Optimize along-strike locking with entire dataset. Graphic: Geological Survey of Canada
Slip Rate Deficit (cm/yr) 35 25 4 Narrow Transition Zone Depth of transition zone (km) 15 3 Narrow Locked Zone 5 5 15 25 35 2 Depth of locked zone (km) 1 Misfit (χ2) 1 3 5 7 9 11 0 • Combined inversion (uplift and strain) • Data misfit weighted by data uncertainties
Misfit for combined Leveling & Horizontal Strain Slip Rate Deficit (cm/yr) 4 3 2 1 35 Misfit (χ2) 25 Depth of transition zone (km) 1 3 5 7 9 11 15 0 5 5 15 25 35 Depth of locked zone (km)
Observed Predicted Residual -3 -2 -1 0 1 2 3 4 0 1 2 3 4 Uplift (mm/yr) | Misfit | (mm/yr)
Observed Strain Rate Predicted Strain Rate 0 50 100 150 Compressional Strain Rate (nanostrain/yr)
Episodic Tremor and Slip (ETS) • Transient slip on the plate interface • Accompanied by emergent tremor • Located 30-45 km depth • Recurrence 10-20 months • Magnitude ~6 Lohman (2010)
2007 Slow Slip Event KTBW east (mm) P423 east (mm) KTBW P423 P420 P420 east (mm) time (days) estimated slip (cm)
2007 Slow Slip Event KTBW predicted east (mm) P423 east (mm) P420 east (mm) time (days) estimated slip (cm)
Consecutive Slow Slip Events Slip rate (mm/day) 3 2 1 0
Slow Slip (cm) 1 2 3 4 5 • Slip inferred from GPS time series • Mosaic of events • (June 2007,May 2008,August 2009) • Tremor from 2005-2007 • Boyarko and Brudzinski(2010) Slow Slip and Tremor in Oregon
Slow Slip (cm) 1 2 3 4 5 0 1 2 3 Slip Rate Deficit (cm/yr)
Slow Slip (cm) 1 2 3 4 5 0 1 2 3 Slip Rate Deficit (cm/yr) Newport Leveling Profile coastline West East Locked ETS Zone Transition Zone Figures by Randy Krogstad (UO)
Slow Slip (cm) 1 2 3 4 5 0 1 2 3 Slip Rate Deficit (cm/yr) Summary • A Cascadia locking model constrained by leveling and horizontal strain rates from GPS. • Wide locked zone in WA and CA; Narrow in OR. • Mo Accumulation Rate: 0.9-1.4 x10²² Nm/century • Mw Accumulation Rate: 8.5-8.7 per century • Spatial separation of locked and ETS zones in OR. • <10% long term locking in ETS zone
BC WA OR CA Holtkamp and Brudzinski (2010)
0 1 2 3 4 0 10 20 30 40 Slip Rate Deficit (cm/yr) Position of 1 cm/yr slip rate deficit contour (% of models) 1000 800 600 North (km) 400 200 0 2 4 6 Seismic Moment Rate (1018 Nm/yr)
Horizontal GPS Observations and Predictions Slip Rate Deficit (cm/yr) 4 3 2 Leveling Observations and Predictions 1 0
Strain Rate from GPS w/ rotation removed Strain Rate from Original GPS 0 50 100 150 Compressional Strain Rate (nanostrain/yr)
Observations of Interseismic Deformation Elevation (m) Uplift rate (mm/yr) West East -3 -2 -1 0 1 2 3 4 East from 20-km-depth slab contour (km) Uplift (mm/yr) (Burgette et al., JGR, 2009)