Download
1 / 1
10 likes | 77 Vues
Supplementary Figure 1. 3 hr. 1 hr. 24 hr. Control + 1x PBS. Control + 1.5 mM DCA. TNFα (100 ng/mL) 1x PBS. TNFα (100 ng/mL) 1.5 mM DCA. Co-Treat with TNFα. Harvest Cells. Serum Starve Cells. Treat Cells with DCA. Actin. P-PDH. PDH. Bax. Bcl-2. Cleaved Caspase 3.

E N D
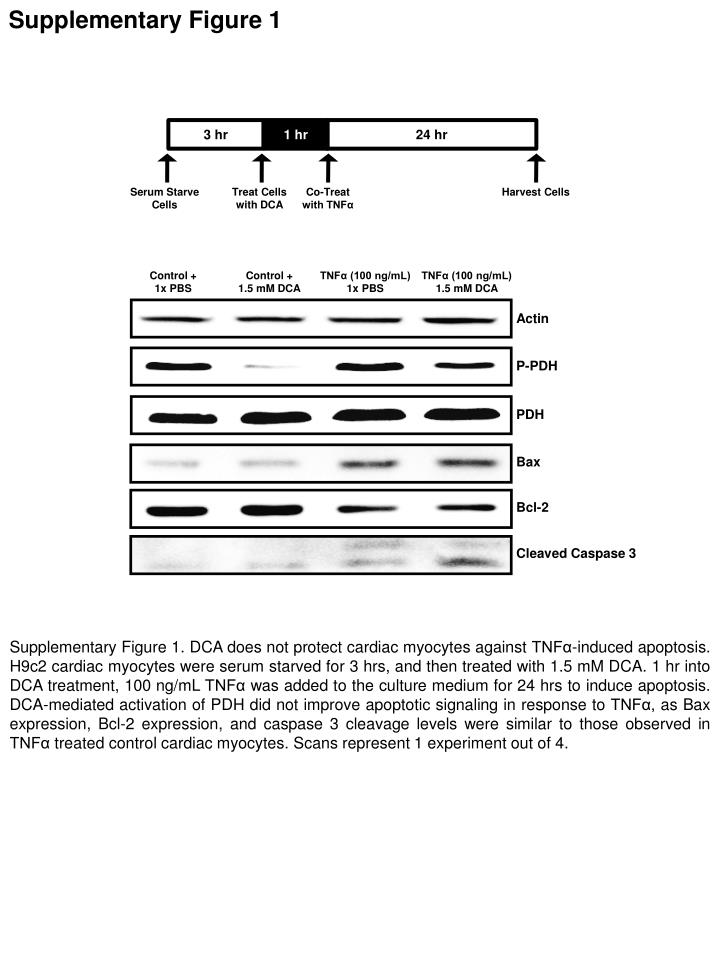
Supplementary Figure 1 3 hr 1 hr 24 hr Control + 1x PBS Control + 1.5 mM DCA TNFα (100 ng/mL) 1x PBS TNFα (100 ng/mL) 1.5 mM DCA Co-Treat with TNFα Harvest Cells Serum Starve Cells Treat Cells with DCA Actin P-PDH PDH Bax Bcl-2 Cleaved Caspase 3 Supplementary Figure 1. DCA does not protect cardiac myocytes against TNFα-induced apoptosis. H9c2 cardiac myocytes were serum starved for 3 hrs, and then treated with 1.5 mM DCA. 1 hr into DCA treatment, 100 ng/mL TNFα was added to the culture medium for 24 hrs to induce apoptosis. DCA-mediated activation of PDH did not improve apoptotic signaling in response to TNFα, as Bax expression, Bcl-2 expression, and caspase 3 cleavage levels were similar to those observed in TNFα treated control cardiac myocytes. Scans represent 1 experiment out of 4.