The Same River Twice: Applied Climatology in a Changing Environment Kelly T. Redmond
The Same River Twice: Applied Climatology in a Changing Environment Kelly T. Redmond Western Regional Climate Center Desert Research Institute Reno Nevada 17 th AMS Conference on Applied Climatology Whistler BC 2008 August 11-14. BAMS, March 1997.

The Same River Twice: Applied Climatology in a Changing Environment Kelly T. Redmond
E N D
Presentation Transcript
The Same River Twice: Applied Climatology in a Changing Environment Kelly T. Redmond Western Regional Climate Center Desert Research Institute Reno Nevada 17th AMS Conference on Applied Climatology Whistler BC 2008 August 11-14
BAMS, March 1997
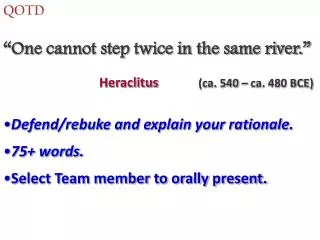
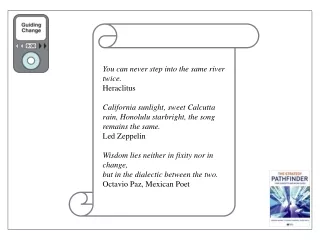
“No man ever sets foot in the same river twice, for it’s not the same river and he’s not the same man.” Heraclitus of Ephesus 535-475 BC
Starting point: • “Applied Climatology: A Glorious Past – An Uncertain Future” • Stan Changnon, 1995, 9th AMS Conference on Applied Climatology, Dallas, January 15-20 • Issues • Whether data and information were being effectively used • Significant problems with data • Gaps between users (or potential users) and providers of data and information. • Concern about an uncertain future for applied climate • Field in the midst of an identity crisis, thus not sufficiently appreciated or understood
AMS 14th Conference on Applied Climatology The Lifelong Work of Stan Changnon 13 January 2004 What’s new ? (ktr) External (world at large) Computing The Web Powerpoint everywhere An increasingly interdisciplinary mindset Health of the environment concerns Climate change prospects Service mentality resurrected Internal (to climate services community) State climate programs more active and visible Regional Climate Center program Regional Integrated Sciences and Assessments program
And a second look: • “Applied Climatology: The Golden Age Has Begun” • Stan Changnon, 2005. Bulletin of the American Meteorological Society, July, 86(7), 915-919. • Even so, still some issues: • Teaching of applied climatology still too limited • Adequacy of instrumentation and data collection • Outreach and awareness still not sufficient • Better information on impacts of extremes • Need better information on climate change effects
What is applied climatology? Stan Changnon (2005): • “My interpretation is that applied climatology describes, defines, interprets, and explains the relationships between climate conditions and countless weather-sensitive activities.” • Its work ranges over four basic areas: • Design of structures and planning of activities • Assessments of current and past conditions, including evaluation of extreme events • Study of the relationships between weather / climate conditions and those in other parts of the physical and socioeconomic worlds • Operation of weather-sensitive systems that employ climatic information in making decisions
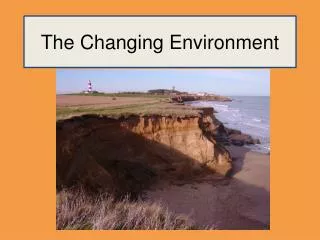
What is changing? • Many of the underlying issues remain the same, • but what is changing is the context. • Changes in climate (the physical system) • Changes in the understanding of climate • Changes in needs for climate information • Old, familiar needs • New needs, new applications, more sophisticated applications
Five themes of interest • Climate stationarity, evolving statistics, challenges /opportunities • Observational underpinnings for climate applications • Quality control, and quality control of quality control • Mountain climates, and related scale issues • The role of a National Climate Service
A preliminary: Applications as forecasts An implicit assumption that has pervaded much of applied climatology Past is Prologue Past statistics = Future statistics The decision that uses the information is about the future Therefore, past values often de facto forecasts Not explicitly recognized as such Past is considered reliable guide to the future Climate stationarity is implicit in this assumption Huge societal investments ($B, $$B, $$$B) Bulletin 17 B
National Research Council January 1999
Water Year Oct-Sep Precip South Coastal California 1895/96 thru 2006/07
Karl and Knight, 1998. Fraction of annual total from upper 10th percentile, US Average.
IDF curves for Bagdad (Arizona!)
1414 Years Redmond, K.T., Y. Enzel, P.K. House, and F. Biondi, 2002. Climate variability and flood frequency at decadal to millennial time scales. pp. 21-45, in Principles and Applications of Paleoflood Hydrology, editors: P.K. House, R.H. Webb, and V.R. Baker, American Geophysical Union, 385 pp.
Redmond, K.T., Y. Enzel, P.K. House, and F. Biondi, 2002. Climate variability and flood frequency at decadal to millennial time scales. pp. 21-45, in Principles and Applications of Paleoflood Hydrology, editors: P.K. House, R.H. Webb, and V.R. Baker, American Geophysical Union, 385 pp.
1. “Stationarity is dead” * Stationarity was never really fully alive. “The history of climate is a nonstationary time series.” * Corollary: There are no true climatic “normals”. * P.C.D. Milly, Julio Betancourt, Malin Falkenmark, Robert M. Hirsch, Zbigniew W. Kundzewicz, Dennis P. Lettenmaier, Ronald J. Stouffer, 2008. Stationarity is dead: Whither water management?. Science, 319 (5863), 573-574, 1 Feb 2008. * Reid A. Bryson, 1997. The Paradigm of Climatology: An Essay. Bulletin of the American Meteorological Society, 78(3), 449-455.
Courtesy of Mike Dettinger, USGS / Scripps. Yesterday Today Tomorrow Dettinger MD. 2005. From climate change spaghetti to climate-change distributions for 21st Century California. San Francisco Estuary and Watershed Science. Vol. 3, Issue 1, (March 2005), Article 4. http://repositories.cdlib.org/jmie/sfews/vol3/iss1/art4
Stationarity, if even alive, is not feeling well … “under the weather” The “present future” will slowly depart from its “prior future” Stationarity slowly but progressively becoming a less valid assumption How much until this departure is “significant” ? (not so much in statistical terms, but in practical terms) Major question looming: How do we adjust all the statistics of the past to reflect the expected future? This is a very big challenge / opportunity for Applied Climatology A growth industry Methodology Application of that methodology Acceptance of that methodology
2. Observations: Real climate change versus fake climate change Change (and variability): Is it observational methodology, or is it climate ??? Is it perception or is it reality ? Is it the perceiver or the perceived ? Do we trust the data ??? The bigger (real) question: Is what we think we believe really true ??
Observations: • A perpetual preoccupation among applied climatologists • Consistency through time as a hallmark of climate observations. • A necessity, not just a convenience. • What is the depth of our commitment to this issue? • The value of an observational record increases nonlinearly with its length. • Some things can only be discovered from long records. • Keep observations going. • QC – Keep obs honest and accurate and representative • (side question: representative of what ?)
Yosemite Valley TMAX Yosemite South Entrance TMAX 2005 1950 2005 1950 John Abatzoglou
Double Mass comparison of Yosemite Valley and South Entrance TMAX 1950 2005
Kelly Redmond Ctsy: surfacestations.org
Chinle Airport, Arizona. HCNM prospect. View to the North, East, West, and South.
HCNM Grid 50 km Radius Green CRN Red TBD Yellow Survey Done Blue In prog
HCN-M Bonus. Security Guards !! Dave Simeral, WRCC
TREX – Terrain Induced Rotors Experiment Independence CA Owens Valley 6 mi 10 km
TREX – Terrain Induced Rotors Experiment Independence CA Owens Valley 1 km 1 mile
Elevation Transect Across Owens Valley south of Independence CA Vertical Exaggeration Approximately 4 X
The Price of Data Quality is Eternal Vigilance. - Thomas Cooperative Observer Jefferson
3. The Essence of Quality Control The evaluation and improvement of imperfect data by making use of other imperfect data.
QC: Observation quality Type I errors : Reject good values (“good” = correct, valid) Type II errors : Accept bad values (“bad” = incorrect, not valid) Often is a trade-off between Type I and Type II error detection Mis-edits: presently, with SOD, about 60 % are bad edits of good data Vetting of QC process. QC the QC. Matte Menne and Imke Durre. Bias detection. Catching subtle errors. PRISM Nipher example. QC in mountains and complex terrain. Scale issues. Fine scale structure in climate averages. Fine scale structure in the spatial correlation field. Differences among elements in the spatial correlation field. Time scale differences in the spatial correlation field. Upwind versus downwind precipitation correlation fields.
QC: Observation quality - 2 Spatial correlation structures Time scale dependent Seasonal Asymmetries – topographic orientation and elevation Surface state – presence / absence of snow cover Baker / Rainier, Corvallis Water Bureau, Pescadero floods “Official” records versus credible records
Big Sur Ranger Station COOP RAWS