Download

1 / 157
1.57k likes | 1.78k Vues
Income and Expenditures. Consumption. Autonomous consumption- The minimum level of consumption that would still exist even if a consumer had absolutely no income. (would occur regardless of a change in income). Saving. Household NOT spending The ability to save is constrained by

E N D
Income and Expenditures
Consumption Autonomous consumption- The minimum level of consumption that would still exist even if a consumer had absolutely no income. (would occur regardless of a change in income)
Saving Household NOT spending The ability to save is constrained by The amount of disposable income The propensity to consume Do households save if Yd = 0? NO
Determinants of C & S Wealth- this is not how much money you make it is made up of savings, assets (stocks and bonds), and real estate Increased wealth .: Inc. C & Dec. S Decreased wealth .: Dec. C & Inc. S Expectations Positive .: Inc C & Dec S Negative .: Dec C & Inc S Household Debt High Debt .: Dec C & Inc S Low Debt .: Inc C & Dec S Taxes Taxes Inc .: Dec C & Dec S Taxes Dec .: Inc C & Inc S
MPC & MPS Marginal Propensity to Consume ΔC/ΔYd % of every extra dollar earned that is spent C DI by $1 Usually between 0 and 1 Marginal Propensity to Save ΔS/ΔYd % of every extra dollar earned that is saved MPC + MPS = 1 1 – MPC = MPS 1 – MPS = MPC
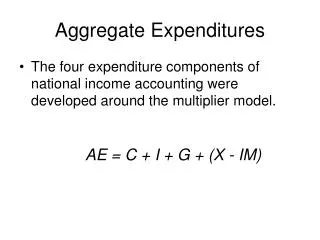
The Spending Multiplier Effect of a change in spending on income/output in the economy C Ig G XN Total Spending small larger _______ changes in spending _______ changes in income/output AE = Aggregate Expenditures = C + I + G + Xn = AD
Key Assumptions of the Spending Multiplier: • The economy supports repetitive, continuous flows of expenditures and income through which dollars spent by Smith are received as income by Chin, then spent by Chin and received as income by Gonzales, and so on. • Any change in income will cause both consumption and saving to vary in the same direction. • Yd __C and __ S A larger disposable income means more is available to spend and save.
Investment = $100 + second-round C = MPC x $100 + third-round C = MPC²x $100 + fourth-round C = MPC³x $100 Total increase in rGDP= (1+ MPC+ MPC² +MPC³) x $100 I= {1/(1-MPC)} x $100
Spending Multiplier Formulas: If the MPS = .20 the MPC = ____ M = ____ If the MPC = .75 the MPS = ____ M = ____ If the MPC = .90 the MPS = ____ M = ____ If the change in GDPE = $20 billion and the change in AE = $5 billion, then the multiplier = ____ and the MPC = _____ and the MPS = _____. M = 1/MPS or 1/1-MPC or GDPE/ AE .80 5 .25 4 .10 10 .75 .25 4
Key Formula: AE x M = GDPE If the GDP gap is $100 billion, how much must AE (C, I, G, or Xn) increase to return the economy to YF if the MPC = .80? M = 1/MPS or 1/1-MPC or GDPE/ AE 5 M = 1/1-MPC = 1/1-.80 = 1/.20 = _____ AE x M = GDPE 20 5 ______ X ______ = 100 Billion
Key Formula: AE x M = GDPE If the GDP gap is $40 billion and the MPS = .25, what amount must AE increase to close the GDP gap? M = 1/MPS or 1/1-MPC or GDPE/ AE 4 M = 1/MPS = 1/.25 = _____ AE x M = GDPE 10 4 ______ X ______ = 40 Billion
Key Formula: AE x M = GDPE If the economy is in a recession and has a GDP gap of $50 billion, how much must government increase G to close the GDP gap and return to full employment, assuming an MPS of .20? M = 1/MPS or 1/1-MPC or GDPE/ AE 5 M = 1/MPS = 1/.20 = _____ AE x M = GDPE ______ X ______ = 50 Billion 10 5
Key Formula: AE x M = GDPE M = 1/MPS or 1/1-MPC or GDPE/ AE • If actual output exceeds potential output (YF) by $80 billion, how much must AE decrease in order to dissipate the inflationary gap, assuming an MPS of .25? 4 M = 1/MPS = 1/.25 = _____ AE x M = GDPE ______ X ______ = 80 Billion 20 4
Does a change in G have the same effect on GDP as a change in T? A change in G affects GDP directly by a multiple of the change in G. A change in T affects GDP by a multiple of less than the change in T. A change in T results in a change in Yd. Yd can be either spent (C) or saved (S); therefore, a change in T only affects GDP by a multiple of the change in C. The initial change in C is less than the change in T. No – G has a greater effect! WHY?
If MPC multiplier • Expectations- when the economy grows then current and future incomes grow • Current income savings • future income savings now • Lifestyle hypothesis- consumers plan their spending over their lifetime (save during peak years) • Most recessions begin as a decrease in investment Permanent income hypothesis
Planned investment spending • Firms intend to undertake • Interest rate • Expected future level of rGDP • Current level of production capacity • Ex. Homebuilders only build what they think they can sell and houses are more affordable and more likely to sell when the interest rate decreases • Firms with investment spending projects will go ahead only if they expect a rate of return higher than the cost of funds they would borrow to finance that project
Expected Rates of Return How does business make investment decisions? Cost / Benefit Analysis How does business determine the benefits? Expected rate of return How does business count the cost? Interest costs How does business determine the amount of investment they undertake? Compare expected rate of return to interest cost If expected return > interest cost, then invest If expected return < interest cost, then do not invest Retained earnings- past profits used to finance I
If a firm has enough capacity to produce it is currently selling at, then it will spend only to replace existing technologies and equipment and other structures that wear out or become obsolete Current level of productive capacity has a negative impact on investment Inventory investment- value of change in total inventories held during a given period (because firms can’t accurately predict sales Unplanned inventory investment- actual sales are less than business expected, leading to an unplanned increased in inventories Actual investment spending- sum of planned investment and unplanned inventory investment If there are unplanned inventories leads to a decrease in the following months production which then leads to a slowing economy
Growth? • 5 machines break and replace all 5 • 5 machines break and replace 2 • 5 machines break and replace all 5 and add 2 more
Investment Demand Curve (ID) What is the shape of the Investment demand curve? Downward sloping Why? When interest rates are high, fewer investments are profitable; when interest rates are low, more investments are profitable Conversely, there are few investments that yield high rates of return, and many that yield low rates of return
The Investment Demand Curve Changes in irRcause changes in IG. Factors other than irRmay shift the entire ID curve irR 5% 3% ID IG $2 trillion $3 trillion
Shifts in Investment Demand (ID) Cost of Production Lower costs shift ID right Higher costs shift ID left Business Taxes Lower business taxes shift ID right Higher business taxes shift ID left Stock of Capital If an economy is low on capital, then ID right If an economy has much capital, then ID left Expectations Positive expectations shift ID right Negative expectations shift ID left Technological Change New technology shifts ID right Lack of technological change shifts ID left
Shifts in Investment Demand When investment demand shifts, different levels of gross private investment occur even while irRremains constant irR 4% ID1 ID IG $2.5 trillion $3.25 trillion
Instability of Investment Durability Capital has a long life-span, therefore once it is built there is no immediate need for further investment Variability of Profits Profitability is subject to the forces of competition, cyclical changes in the economy, and human management decisions Variability of Expectations Political, social and natural phenomenon shape our positive and negative expectations of the future Irregularity of Innovation Innovation does not proceed in a smooth linear fashion, instead there are bursts of innovation followed by periods of relative stability
Aggregate Demand (AD) • Define aggregate demand as the total demand for an economy’s output (production of goods and services) over a given period of time. • Shows the amount of Real GDP that the private, public and foreign sector collectively desire to purchase at each possible price level • Households (consumption), firms (investment), the public sector (government spending) or foreign households, firms, or governments (net exports). • YAD = C + I + G + NX • The relationship between PL and rGDP is inverse
Aggregate Demand Curve PL AD GDPR
The Wealth Effect (P and C ) 0 Suppose P rises. • The dollars people hold buy fewer g&s, so real wealth is lower. • People feel poorer. Result: C falls.
The Interest-Rate Effect (P and I ) 0 Suppose P rises. • Buying g&s requires more dollars. • To get these dollars, people sell bonds or other assets. • This drives up interest rates. Result: I falls.(Recall, I depends negatively on interest rates.)
The Exchange-Rate Effect (P and NX ) 0 Suppose P rises. • U.S. interest rates rise (the interest-rate effect). • Foreign investors desire more U.S. bonds. • Higher demand for $ in foreign exchange market. • U.S. exchange rate appreciates. • U.S. exports more expensive to people abroad, imports cheaper to U.S. residents. Result: NX falls.
The Slope of the ADCurve: Summary An increase in P reduces the quantity of g&s demanded because: P P2 Y Y2 0 • the wealth effect (C falls) P1 • the interest-rate effect (I falls) AD • the exchange-rate effect (NX falls) Y1
Price Level PL2 PL1 AD Real GDP Y2 Y1 Aggregate Demand Curve ↑ PL ____ Real Output Purchased PL ____ Real Output Purchased PL quantity of real output purchased Movement Along the AD Curve Y = output = income Real GDP = Real Output
Shifts in Aggregate Demand (AD) • There are two parts to a shift in AD: • A change in C, IG, G and/or XN • A multiplier effect that produces a greater change than the original change in the 4 components • Increases in AD = AD right • Decreases in AD = AD left
Consumption • Consumer wealth • More wealth = more spending (AD shifts right) • Less wealth = less spending (AD shifts left) • Consumer expectations • Positive expectations = more spending (AD shifts right) • Negative expectations = less spending (AD shifts left)
Consumption Cont’d • Household indebtedness • Less debt = more spending (AD shifts right) • More debt = less spending (AD shifts left) • Taxes • Less taxes = more spending (AD shifts right) • More taxes = less spending (AD shifts left)
Gross Private Investment • The Real Interest Rate • Lower Real Interest Rate = More Investment (AD right) • Higher Real Interest Rate = Less Investment (AD left) • Expected Returns • Higher Expected Returns = More Investment (AD right) • Lower Expected Returns = Less Investment (AD left) • Expected Returns are influenced by • Expectations of future profitability • Technology • Degree of Excess Capacity (Existing Stock of Capital) • Business Taxes
What Will Shift AD to The Right? AD2 AD1 PL Change in Consumer Spending Consumer Wealth [increases/decreases] [stocks/houses] [stable prices] Consumer Expectations[about future prices (increases/decreases) Consumer Expectations about future income [positive/negative] Consumer Indebtedness [low/high] Personal Taxes [increase/decrease] Real Interest Rate [stable prices] [increase/decrease] Change in Investment Spending High Debt Real Interest Rates [stable prices] [increase/decrease] [Positive/Negative] Profit Returns [Business taxes [increase/decrease] [Depleted/Excess] inventory stockpiles in the supply chain
Why the Inverse Relationship? ↑ PL ____ Real Output Purchased PL ____ Real Output Purchased The Wealth Effect Wealth and income are different. Income is earned from use of factors of production. Wealth is accumulation of savings, financial investments, real estate, etc. Wealth is separate from Income. ↑PL ____ purchasing power of accumulated wealth _____ current consumption _____ real output purchased. PL ____ purchasing power of accumulated wealth _____ current consumption _____ real output purchased.
Why the Inverse Relationship? ↑ PL ____ Real Output Purchased PL ____ Real Output Purchased The Interest Rate Effect The interest rate (i) is the price of borrowed money. ↑PL ____ DM ____ interest rate ____ C / I (interest rate sensitive consumption/investment) _____ real output purchased. PL ____ DM ____ interest rate ____ C / I (interest rate sensitive consumption/investment) _____ real output purchased.
Why the Inverse Relationship? ↑ PL ____ Real Output Purchased PL ____ Real Output Purchased The Foreign Purchases Effect ____ real output purchased ___ relative price of X ___ X ___ Xn PL ___ relative price of M ___ M ____ real output purchased ___ relative price of X ___ X ___ Xn PL ___ relative price of M ___ M X = exports; M = imports; X-M = Net Exports (Xn)
Government Spending • More Government Spending (AD shift right) • Less Government Spending (AD shift left)
Net Exports • Exchange Rates (International value of $) • Strong $ = More Imports and Fewer Exports = (AD shift left) • Weak $ = Fewer Imports and More Exports = (AD shift right) • Relative Income • Strong Foreign Economies = More Exports = (AD shift right) • Weak Foreign Economies = Less Exports = (AD shift left)
1. The process of combining all individual product pricesandquantities into a single unit is (deduction/conglomeration/aggregation).2. The AD curve shows the amount of (real/nominal) domesticoutput which will be purchased at each possible (price/price level).3. The AD curveis always (up/down) sloping & shows a(an)(direct/inverse) relationship between output & (price/price level).4. The income & substitution effects (do/do not) apply to the AD curve. Change in AQD Price Level Change Point to Pointmovements AD PL1 PL2 AQD PL AQD1 AQD2
5. The interest rate effect suggests that an increase in the PL will (incr/decr) the demand for money, (incr/decr) interest rates and (increase/decrease) consumption and investment which would cause a(an) (increase/decrease) in (AD/AQD). 6. The real-balances effect indicates a higher price level will (increase/decrease) the real value of money, (increase/decrease) consumption, and therefore (increase/decrease) (AD/AQD). 7. The foreign purchase effect suggests that an increase in PL relative to other countries (increase/decrease) our exports and (incr/decr) our imports which would (incr/decr) (AD/AQD). AD PL2 PL1 Higher PL Lower PL AQD2AQD1
19. An increase in theprice of imported resources [resource cost]would cause the (AD/AS) curve to shift (rightward/leftward). 20. Arightward shiftof thePPCwill shift the (AD/AS) curve to the (right/left). 21. Animprovement in productivity[technological improvement] will shift the (AD/AS) curve to the (right/left). Suppose that real domestic output is40 units, the quantity of inputs is20& the price of each input is$8. 22. What is the level of productivity? Productivity(__) = Output(40) Inputs (20) 23. What is the per unit cost of production? Total input cost $160($8x20) Per unit production cost ($___) = Units of output (40) 24. If the price of each input increased from $8 to $12, productivity would (increase/decrease/ remain unchanged. [affects only per unit cost] 25. Increase in input price [$8 to $12] would shift the (AD/AS) curve (right/left). 2 4 26. Anincrease in the price of imported resourceswould increase per unit production cost and shift the (AD/AS) curve to the (right/left). 27. Adepreciation of the dollarwould cause imported inputs to be more expensive & shift the AS curve to the (right/left), however, the cost of our products would decrease so it would shift the AD curve (right/left).
8. There are (3/4) AD Shifters, that havenothingto do with PL. They are consumption (“C”), investment (“IG”), “G” , & Xn. 9. An increase in consumption will shift the (AD/AS) curve to the (right/left). 10. (A change in PL/A decline in the interest rate no change in PL) will cause a shift in the AD curve to the (right/left). 11. An increase in the PL will cause a (shift in the AD curve to the left/shift in the AD curve to theright/decrease in AQD[movement up along a stable AD curve]). 12. An increase in investmentcaused by adecline in the interest rate [independent of the PL] will(cause a movement along a stable/shift the) AD curve to the (right/left). 13. If the government decides to spend $60 billion on the infrastructure, this will shift the (AD/AS) curve to the (right/left). 14. If the national incomes of our major trading partners were to decrease, [therefore Xn will change] our (AD/AS) curve would shift to the (right/left). 15. (An increase in the PL/A decline in business taxes)would not shift the AS curve. 16. “Range 1” of the AS curve is call_____________, “range 2” is called _____________, & “range 3” is called _________. 17. An increase in the PL will cause a(n) (shift to the right of the AS curve/ shift to the left of the AS curve/increase in the AQS [move up a stable AS curve]). 18. A decrease in the PL will cause a(n) (shift to the left of the AS curve/shift to the right of the AS curve/decrease in AQS [move down a stable AS curve[) Horizontal 3 Classical Intermediate 2 1
Aggregate Supply • The level of Real GDP (GDPR) that firms will produce at each Price Level (PL) • Is producing a unit profitable or not? • Increases in the price-level will increase firm’s profits and create incentives to increase output. As the price-level falls, firm’s profits drop and this creates an incentive to reduce output. • However, nomial wages and other input prices are fixed and don’t have time to adjust to price level changes Short-Run Aggregate Supply (SRAS)
1. The Sticky-Wage Theory 0 • Imperfection: Nominal wages are sticky in the short run,they adjust sluggishly. • Due to labor contracts, social norms • Firms and workers set the nominal wage in advance based on PE, the price level they expect to prevail.
1. The Sticky-Wage Theory 0 • If P > PE, revenue is higher, but labor cost is not. Production is more profitable, so firms increase output and employment. • Hence, higher P causes higher Y, so the SRAS curve slopes upward.
2. The Sticky-Price Theory 0 • Imperfection: Many prices are sticky in the short run. • Due to menu costs, the costs of adjusting prices. • Examples: cost of printing new menus, the time required to change price tags • Firms set sticky prices in advance based on PE.
2. The Sticky-Price Theory 0 • Suppose the Fed increases the money supply unexpectedly. In the long run, P will rise. • In the short run, firms without menu costs can raise their prices immediately. • Firms with menu costs wait to raise prices. Meanwhile, their prices are relatively low, which increases demand for their products,so they increase output and employment. • Hence, higher P is associated with higher Y, so the SRAS curve slopes upward.