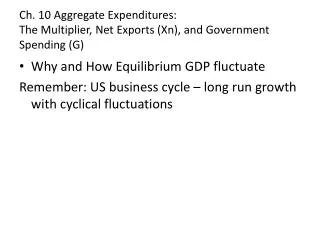
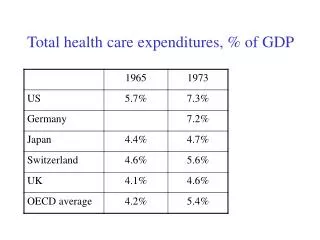
Download
1 / 31
310 likes | 410 Vues
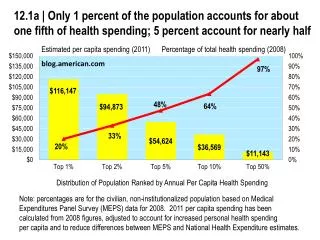
Learn how aggregate demand affects the economy with factors influencing spending, price levels, and growth trends. Explore the concepts through informative visuals and detailed explanations.

E N D
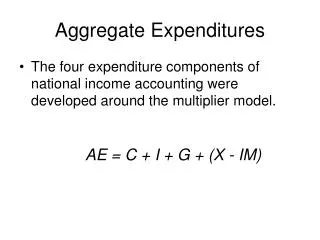
Spending and Total Expenditures • Aggregate Demand • The total of all planned expenditures in the economy • Aggregate Supply • The total of all planned production in the economy
Spending and Total Expenditures • Questions • What determines the total amount that individuals, governments, firms, and foreigners want to spend? • What determines the equilibrium price level?
Aggregate demand = C + I + G + X The Aggregate Demand Curve • Aggregate Demand Curve • A curve showing planned purchase rates for all goods and services in the economy at various price levels, all other things held constant
As the price level rises, real GDP demand declines A AD The Aggregate Demand Curve 140 120 Price Level 100 0 6 7 8 9 10 11 12 Real GDP per Year($ trillions)
The Aggregate Demand Curve 140 B 120 Price Level A 100 AD 0 6 7 8 9 10 11 12 Real GDP per Year($ trillions)
The Aggregate Demand Curve C 140 B 120 Price Level A 100 AD 0 6 7 8 9 10 11 12 Real GDP per Year($ trillions) Figure 10-4
The Aggregate Demand Curve • What happens when the price level rises? • The Real-Balance Effect (wealth effect) • The Interest Rate Effect • The Open Economy Effect
The Aggregate Demand Curve • The Real-Balance Effect • The change in the real value of money balances when the price level changes
The Aggregate Demand Curve • The Interest Rate Effect • Higher price levels indirectly increase the interest rate.
The Aggregate Demand Curve • The Open Economy Effect • Higher price levels result in foreigners’ desiring to buy fewer American-made goods while Americans desire more foreign-made goods (i.e., net exports fall).
Aggregate Demand versus Demand for a Single Good • When the aggregate demand curve is derived, we are looking at the entire circular flow of income and product. • When a demand curve is derived, we are looking at a single product in one market only.
Shifts in the Aggregate Demand Curve • Any non-price-level change that increases aggregate spending (on domestic goods) shifts AD to the right. • Any non-price-level change that decreases aggregate spending (on domestic goods) shifts AD to the left.
Shifts in the Aggregate Demand Curve • Any non-price-level change that increases aggregate spending (on domestic goods) shifts AD to the right. • Any non-price-level change that decreases aggregate spending (on domestic goods) shifts AD to the left.
Factors Increasing Aggregate Demand • A drop in the foreign exchange value of the dollar • Increased security about jobs and future income • Improvements in economic conditions in other countries • A reduction in real interest rates (nominal interest rates corrected for inflation) not due to price level changes • Tax decreases • An increase in the amount of money in circulation
AD Shifts in the Aggregate Demand Curve 120 GDP Deflator 90 0 1 2 3 4 5 6 7 Real GDP per Year($ trillions)
AD Shifts in the Aggregate Demand Curve 120 GDP Deflator 90 0 1 2 3 4 5 6 7 Real GDP per Year($ trillions)
AD Shifts in the Aggregate Demand Curve Increase in aggregate demand 120 GDP Deflator 90 AD1 0 1 2 3 4 5 6 7 Real GDP per Year($ trillions)
Factors Decreasing Aggregate Demand • A rise in the foreign exchange value of the dollar • Decreased security about jobs and future income • Declines in economic conditions in other countries • A rise in real interest rates (nominal interest rates corrected for inflation) not due to price level changes • Tax increases • A decrease in the amount of money in circulation
AD Shifts in the Aggregate Demand Curve 120 GDP Deflator 90 0 1 2 3 4 5 6 7 Real GDP per Year($ trillions)
AD Shifts in the Aggregate Demand Curve 120 GDP Deflator 90 0 1 2 3 4 5 6 7 Real GDP per Year($ trillions)
AD1 Shifts in the Aggregate Demand Curve Decrease in aggregate demand 120 GDP Deflator 90 AD 0 1 2 3 4 5 6 7 Real GDP per Year($ trillions)
The Aggregate Supply Curve • The Long-Run Aggregate Supply Curve • Real output at full employment • A vertical line representing real output based on full information and after full adjustment has occurred
Long-Run Equilibrium and the Price Level Figure 10-5
Long-Run Equilibrium and the Price Level • Long-run equilibrium occurs at the intersection of the LRAS curve and the AD curve • Equilibrium price level is determined • Planned real expenditures for the economy are equal to total planned production along the economy’s trends growth path
The Effects of Economic Growth on the Price Level Figure 10-6, Panel (a)
The Effects of Economic Growth on the Price Level Figure 10-6, Panel (b)
The Effects of Economic Growth on the Price Level • Secular Deflation • An increase in LRAS will, ceteris paribus, result in a decrease in the price level. • Avoiding Secular Deflation • If the AD curve shifts outward by the same amount as the LRAS curve,the price level remains constant. • The AD curve can be shifted outward by increasing the money supply.
Inflation Rates in the United States Source: Economic Report of the President; Economic Indicators, various issues Figure 10-7
Causes of Inflation:Supply-Side Inflation • When LRAS1 shifts to LRAS2, the price level rises from 120 to 140 • Inflation is caused by a decrease in LRAS. Figure 10-8, Panel (a)
Causes of Inflation:Demand-Side Inflation An increase in AD from AD1 to AD2 causes the price level to rise from 120 to 140. An increase in AD causes inflation. Figure 10-8, Panel (b)
Causes of Inflation:Economic Growth and Inflation Source: Economic Report of the President; Economic Indicators, various issues Figure 10-9