Download
1 / 2
20 likes | 349 Vues
"In statistics, there are many discrete probability distributions. The binomial distribution is a discrete probability distribution that describes the probability of success in a binomial experiment. Learn more with CK-12 Flexbooks"

E N D
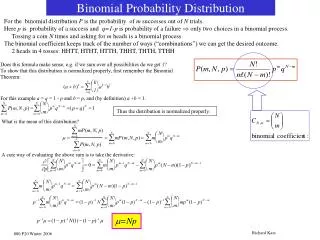
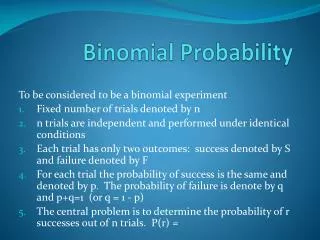
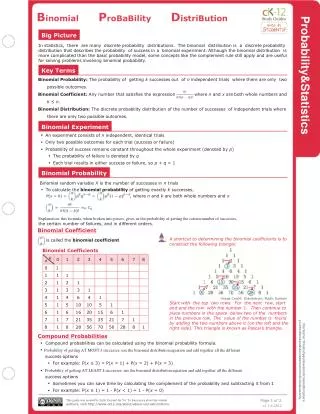
Binomial ProBaBility DistriBution Probability&Statistics Study Guides Big Picture In statistics, there are many discrete probability distributions. The binomial distribution is a discrete probability distribution that describes the probability of success in a binomial experiment. Although the binomial distribution is more complicated than the basic probability model, some concepts like the complement rule still apply and are useful for solving problems involving binomial probability. Key Terms Binomial Probability: The probability of getting k successes out of n independent trials where there are only two possible outcomes. Binomial Coefficient: Any number that satisfies the expression where n and x are both whole numbers and k ≤ n. Binomial Distribution: The discrete probability distribution of the number of successes of independent trials where there are only two possible outcomes. Binomial Experiment • An experiment consists of n independent, identical trials • Only two possible outcomes for each trial (success or failure) • Probability of success remains constant throughout the whole experiment (denoted by p) • The probability of failure is denoted by q • Each trial results in either success or failure, so p + q = 1 Binomial Probability Binomial random variable X is the number of successes in n trials • To calculate the binomial probability of getting exactly k successes, , where n and k are both whole numbers and x Explanation: this formula, when broken into pieces, gives us the probability of getting the certain number of successes, the certain number of failures, and in different orders. Binomial Coefficient A shortcut to determining the binomial coefficients is to is called the binomial coefficient construct the following triangle: Binomial Coefficients k 0 1 2 3 4 5 6 7 8 n 0 1 1 1 1 2 1 2 1 3 1 3 3 1 4 1 4 6 4 1 Image Credit: Drandstrom, Public Domain Start with the top two rows. For the next row, start 5 1 5 10 10 5 1 and end the row with the number 1. Then continue to 6 1 6 16 20 15 6 1 place numbers in the space below two of the numbers in the previous row. The value of the number is found 7 1 7 21 35 35 21 7 1 yourtextbookandisforclassroomorindividualuseonly. by adding the two numbers above it (on the left and the Disclaimer:thisstudyguidewasnotcreatedtoreplace 8 1 8 28 56 70 56 28 8 1 right side). This triangle is known as Pascal’s triangle. Compound Probabilities • Compound probabilities can be calculated using the binomial probability formula. • Probability of getting AT MOST k successes: use the binomial distribution equation and add together all the different success options • For example: P(x ≤ 3) = P(x = 1) + P(x = 2) + P(x = 3) • Probability of getting AT LEAST k successes: use the binomial distribution equation and add together all the different success options • Sometimes you can save time by calculating the complement of the probability and subtracting it from 1 • For example: P(x ≥ 1) = 1 - P(x < 1) = 1 - P(x = 0) Page 1 of 2 This guide was created by Lizhi Fan and Jin Yu. To learn more about the student authors, visit http://www.ck12.org/about/about-us/team/interns. v1.1.9.2012
Binomial ProBaBility DistriBution cont. Binomial Probability Distribution The binomial distribution is found by calculating the binomial probabilities for k = 0, 1, 2,..., n. • A discrete probability distribution because k can only be whole numbers • Can be represented in a histogram with k along the x-axis and P(k) along the y-axis Mean for the binomial distribution: μ = np Standard deviation for the binomial distribution: Strategy: Probability 1. Define what a success is 2. Determine p and n 3. Use the binomial formula to find the mean and standard deviation. Graphing Calculator In a graphing calculator, we can use a built-in command to find the binomial distribution. The command is: binompdf(n,p,k). n is the number of trials, p is the probability of success, and k is the number of successes we want to have. This will give us the probability of k successes occurring. There is a similar command called binomcdf, which requires us to plug in two values for the number of successes we want to have: one low and one high. It will give us the probability that the number of successes fall between the two values. If you can’t find the commands, check the manual for your graphing calculator. For the TI-83/TI-84, the commands are found by pressing [2ND][DISTR]. Notes Page 2 of 2