Download

1 / 0
The Binomial Probability Distribution and Related Topics
0 likes | 164 Vues
The Binomial Probability Distribution and Related Topics. Note:. A quantitative variable x is a random variable if the value that x takes on in a given experiment or observation is a chance or random outcome. Two types of random variable.
Télécharger la présentation 
The Binomial Probability Distribution and Related Topics
An Image/Link below is provided (as is) to download presentation
Download Policy: Content on the Website is provided to you AS IS for your information and personal use and may not be sold / licensed / shared on other websites without getting consent from its author.
Content is provided to you AS IS for your information and personal use only.
Download presentation by click this link.
While downloading, if for some reason you are not able to download a presentation, the publisher may have deleted the file from their server.
During download, if you can't get a presentation, the file might be deleted by the publisher.
E N D
Presentation Transcript
-
The Binomial Probability Distribution and Related Topics
- Note: A quantitative variable x is a random variable if the value that x takes on in a given experiment or observation is a chance or random outcome
- Two types of random variable Discrete random variable: can take on only a finite number of values or a countable number of values Continuous random variable: can take on any of the countless number of values in a line interval
- Example: Discrete random variable: number of students in my statistics class. I can have 38, 34, 25, 20 students. I can NOT have 25.5 students. Continuous random variable: Pumping air in a tire. I can have 0 psi, 20.125 psi, 33.5 psi, etc.
- Group Activity: Identity discrete or continue random variable A) Measure the time when students, selected at random, submit college applications. B) Count the number of bad checks on a day selected at random. C) Measure the amount of gasoline you put in a car when you fill up the tank. D) Random sample of how many people voted in the Presidential Election
- Answer A) Continuous random variable B) Discrete random variable C) Continuous Random Variable D) Discrete random variable
- Probability Distribution Probability distribution is an assignment of probabilities to each distinct value of a discrete random variable or to each interval of values of a continuous random variable
- Note: Features of the probability distribution of a discrete random variable 1) The probability distribution has a probability assigned to each distinct value of the random variable 2) The sum of all the assigned probabilities must be 1
- Example of discrete probability distribution Convert this chart into the probability distribution (relative frequency table) then graph it P(3 or 4)=
- Answer A
- Answer B P(3 or 4) = P(3)+P(4)=.74
- Group Activity: Frequencies of Alphabets in a 1000-Letter Sample
- Questions: A) Fill out the probability chart B)do the probabilities of all the letters add up to 1? C) If a letter is selected at random what is the probability that it will be a vowel?
- A) Just do it B) yes of course C) P(a,e,i,o, or u) = 0.378
- Mean and standard deviation again!?! Yes! But it’s for discrete population probability distribution. ; ; X is the value of a random variable, P(x) is the probability of that variable, and sum is taken for all the values of the random variable
- Note: Why was that in population symbol? It is because sum is taken over all values of the random variable (i.e. the entire sample space)
- Example: Sad fact
- Answer So the mean is 1.67 And the standard deviation is .9064
- Group Activity At a carnival, you pay $2.00 to play a coin flipping game with 3 fair coins. One of each coin one side has the number 0 and another with number 1. You flip the three coins at one time and you win $1.00 for every 1 that appears on top. Are your expected earnings equal to the cost to play?
- Fill this out and find , so who is making money here?
- Linear Functions of a Random Variable Let a and b be any constants, and let x be a random variable. Then the new random variable L = a+bx is called a linear function of x Then the linear function L= a + bx has mean, variance, and standard deviation as follows: =
- Linear Combinations of Independent Random variables And
- Uh….so what does that mean? Here are some examples: Let and A) Let L = 3 + 2, compute the mean, variance, and SD of L =
- Continue Let and B) Let W=. Find the mean, variance, and standard deviation of W
- Group Work Let and C) W= . Find the mean, variance and standard deviation of W D) Find the mean, variance and standard deviation of W
- Answer C) 25, 337, 18.36 D) 125, 2628, 51.26
- Homework Practice Pg 178 #1-17 every other odd
- Binomial Probabilities
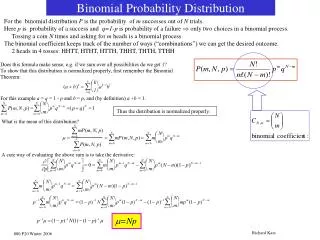
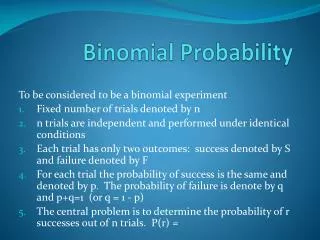
- Features of a binomial experiment 1) There are a fixed number of trials. We denote this number by the letter n 2) The n trials are independent and repeated under identical conditions 3) Each trial has only two outcomes: success, denoted by S and failure, denoted by F 4) For each individual trial, the probability of success is the same. We denote the probability of success by p and that of failure by q. Since each trial results in either success or failure, p+q=1 and q=1-p 5) The central problem of a binomial experiment is to find the probability of r successes out of n trials.
- Example: Read pg 183 Read pg 183 example 4
- Group Work: You are taking the final and you are running out of time. You have 3 multiple choice questions left and each question has 4 choices. 1) What’s the probability of getting all 3 questions correct? 2) What’s the probability of getting at least 1 correct?
- Answers There are 8 outcomes. S is success, F is Failure. SSS SSF SFS FSS SFF FSF FFS FFF P(S)= .25 P(F)= .75 1) SSS = (.25)(.25)(.25)=.016 2) Getting at least 1 correct means, all of the outcomes other than FFF. FFF = (.75)(.75)(.75)= .422. So 1-.422=.578
- Continue with the last one: 1) What’s P(1)? (One correct) 2) What’s P(2)? (two correct)
- Answer 1) .422 2) .141
- Are there any way to do this without doing all the outcomes? Yes! It’s called Binomial probability distribution
- What is Binomial Probability Distribution? You can use this when the outcomes is either success or fail. N=number of trials p=probability of success on each trial q=1-p=probability of failure on each trial r=random variable representing the number of success out of n trials
- Example: Basketball shooting example Mr. Liu makes 30% of his shots. What’s the probability that he makes at least 2 fg out of 4 shots? n=4 p=.3 q=.7 r=2,3,4
- Group Work: Privacy is a concern for many users of the Internet. One survey showed that 62% of Internet users are somewhat concerned about the confidentiality of their e-mail. Based on this information, what is the probability that for a random sample of 10 internet users, 6 are concerned about the privacy of their e-mail?
- Answer
- Group Work A biologist is studying a new hybrid tomato. It is known that the seeds of this hybrid tomato have probability of .70 of germinating. The biologist plants 10 seeds. A) What’s the probability that exactly 8 seeds germinate? B) What’s the probability that 4 or less will germinate?
- Homework Practice Pg 191 #2-24 every other even
- Additional Properties of the Binomial Distribution
- How to Graph a Binomial Distribution 1) Place r values on the horizontal axis 2) Place P(r) values on the vertical axis 3) Construct a bar over each r value extending from r-0.5 to r+0.5. The height of the corresponding bar is P(r).
- Example of a graph of binomial distribution
- Group Work: A waiter at the restaurant has learned from experience that the probability that a lone diner will leave a tip is only 0.7. During one lunch hour, the waiter serves six people who are dining by themselves. Calculate the probabilities and then make a graph of the binomial probability distribution that shows the probabilities that 0,1,2,3,4,5, or all 6 lone diners leave tips Hint: Use binomial probability formula
- Answer
- Group Work: Jamal enjoys playing basketball. He figures that he makes about 45% of his shot attempts during the game. Calculate the probabilities and make a histogram showing the probability that Jamal will make 0,1,2,3,4,5 shots out of 5 attempted field goals Based on the probabilities, make a prediction how many shots Jamal will make out of 5?
- How to calculate the mean and standard deviation. expected number of successes for random variable r is the standard deviation for the random variable r r is a random variable representing the number of successes in a binomial distribution n is the number of trials p is the probability of success on a single trial q=1-p is the probability of failure on a single trial
- Practice!
- Answer 4.2 1.12
- Find out the expected value and standard deviation for Jamal’s basketball shooting. A) What is the expected value for Jamal? Is it the same as you predicted before? B) What is the standard deviation of the binomial distribution?
- Unusual Value Note: Chebysev’s Theorem tells us that no matter what the data distribution looks like, at least 75% will fall within 2 standard deviations of the mean. When distribution is mound-shaped and symmetrical, about 95% of the data are within 2 standard deviations of the mean. Data value might be an outlier when it is more than 2.5 standard deviations away from the mean. For binomial distribution, it is unusual for the number of successes r to be higher than
- What does it mean? If 4.2 1.12 then =7 and =1.4 That means anything higher than 7 and lower than 1.4 are outliers.
- How to express binomial probabilities using equivalent formulas
- Example: Investments can be profitable as well as risky. Suppose you consider companies with a 35% estimated risk of default and suppose you want to be 95% certain of meeting your goal of at least 4 good stock. How many stocks should you buy to meet this goal? Please look at the table Appendix II starting in A11. It is a binomial table. We want Since the probability of success is .65 , we look at the binomial table under p=0.65 and different values of n to find the smallest value of n that will satisfy the relation.
- Answer N=10 because 1-0-0-0.004-0.021=.975
- Homework Practice Pg 203 #1-23 odd
- The Geometric and Poisson Probability Distributions
- Why do we use Geometric Distribution? Suppose we have an experiment in which we repeat binomial trials until we get our first success, and then we stop. Let n be the number of the trial on which we get our first success. In this context, n is not a fixed number. In fact, n could be any of the numbers 1,2,3… so on. What is the probability that our first success comes on the nth trials? Geometric probability distribution tells us that.
- Geometric Probability distribution Where n is the number of the trial on which the first success occurs (n=1,2,3…) and p is the probability of success on each trial. Note: p must be the same for each trial.
- Note: In many real-life situations, we keep on trying until we achieve success. This is true in areas as diverse as diplomacy, military science, real estate sales, general marketing strategies, medical science, engineering, and technology
- Example: Robotics class made a robot designed to look for ultrasonic sensor within a certain time frame. If it does not locate it, it will try again and find it. From experience, it is only 80% successful. The robot will keep trying until it finds the sensor or the time is up and it ends. A) what is the probability that the robot’s first success will be on attempts n=1, 2, or 3? B) If the robot has a max of 3 tries, what is the probability that the robot will find the sensor?
- Answer A) B) P(n=1or2or3)=P(1)+P(2)+P(3)=.80+.16+.032=.992 or 99.2% of the time it will find the sensor
- Poisson Probability Distribution Poisson distribution applies to accident rates, arrival times, defect rates, the occurrence of bacteria in the air, and many other areas of everyday life.
- Poisson Probability Distribution Let (lambda) be the mean number of successes over time, volume, area, and so forth. Let r be the number of successes (r=0,1,2,3,…) in a corresponding interval of time, volume, area and so forth. Then the probability of r successes in the interval is e is approximately equal to 2.7183 Using some mathematics involving infinite series, it can be shown that the population mean and standard deviation of the Poisson distribution are
- Example: You are Indiana Jones. You went to an excavation site to try to dig up different things from the past. You have a record of getting .68 things per hour. Suppose youdecide to find out how many different things you can dig up in 7 hours. A) Use the information provided to find a probability distribution for r, in a period of 7 hours B) What is the probability that in 7 hours, you will dig 0,1,2 or 3 things? C) What’s the probability of digging 4 or more things?
- Answer A) B) C)
- Group Work You went to a frozen lake called I-Get-To-Catch-Fish Lake. It is told that on average, fishermen can fish up to .76 fishes per hour. Suppose you and your buddy went to go fishing for 6 hours A) Find a probability distribution for r, the number of fish you catch in a period of 6 hours B) What the probability that in 6 hours you will get 0,1,2,3, or 4 fish? C) What’s the probability you catch 5 of more fish?
- Answer A) B) C)
- How to Approximate Binomial Probabilities Using Poisson Probabilities Poisson distribution can be used as a probability distribution for “rare” events. Suppose you have a binomial distribution with n= number of trials r= number of successes p=probability of success on each trial If then r has a binomial distribution that is approximated by a Poisson distribution with (expected value)
- Example: INFJ is a rare personality type. It occurs in only about 2.1% of the population. Suppose a high school graduating class has 170 students, and suppose success of the event is the personality type INFJ A) Let r be the number of success in the n=170 trials. p=P(S)=.021, will the Poisson distribution be a good approximation to the binomial? B) Estimate the probability that this graduating class has 0,1,2,3 or 4 people who have the INFJ personality type C) Estimate the probability that this class has five or more INFJ personality types.
- Answer A) Since n=170 is greater than 100 and Poisson distribution should be a good approximation to the binomial. B) C)
- Select appropriate distribution Identify the type of probability distribution needed to solve the problem: binomial, geometric, Poisson, or Poisson approximation to the binomial. Then solve the problem. Denver, Colorado, is prone to severe hailstorms. Insurance agents claim that a homeowner in Denver can expect to replace his or her rough once every 10 years. What is the probability that in 12 years a homeowner in Denver will need to replace the roof twice?
- Answer Poisson Distribution Since 1 per 10 years = 0.1 per year
- Select appropriate distribution Identify the type of probability distribution needed to solve the problem: binomial, geometric, Poisson, or Poisson approximation to the binomial. Then solve the problem. A telephone network substation will keep trying to connect a long-distance call to a trunk line until the fourth attempt has been made. After the fourth unsuccessful attempt, the call number goes into a buffer memory bank, and the caller gets a recorded message to be patient. During peak calling periods, the probability of a call connecting to trunk line is 65% on each try. What percentage of all calls made during peak time will wind up in the buffer memory bank?
- Answer Geometric probability P(S)=0.65=p P(5 or more)=1-p(4 or less)=1-.65-.2275-.0796-.0276=.015 or 1.5%
- Select appropriate distribution Identify the type of probability distribution needed to solve the problem: binomial, geometric, Poisson, or Poisson approximation to the binomial. Then solve the problem. The murder rate is 3.6 murders per 100,000 inhabitants. In a community of 1254 people, what is the probability that at least one person will be murdered?
- Answer Poisson approximation to the binomial n=1254 p=3.6/100000 = .000036 np=.045 Since n=1254 >100 and np=.045 <10 we can use the poisson approximation .956 P(1 or more)=1-p(0)=1-.956=.044 or 4.4%
- Homework Practice P217 #1-26 every other even


More Related