Binomial Probability Distributions
280 likes | 309 Vues
Learn about random variables, probability distributions, and binomial experiments in this comprehensive guide. Understand how to calculate probabilities, means, and deviations for discrete variables. Discover the Poisson distribution and its applications.

Binomial Probability Distributions
E N D
Presentation Transcript
Chapter 5 The Binomial Probability Distribution and Related Topics Understandable Statistics Ninth Edition By Brase and Brase Prepared by Yixun Shi Bloomsburg University of Pennsylvania
Statistical Experiments and Random Variables Statistical Experiments – any process by which measurements are obtained. A quantitative variable, x, is a random variable if its value is determined by the outcome of a random experiment. Random variables can be discrete or continuous.
Random Variables and Their Probability Distributions Discrete random variables – can take on only a countable or finite number of values. Continuous random variables – can take on countless values in an interval on the real line Probability distributions of random variables – An assignment of probabilities to the specific values or a range of values for a random variable.
Discrete Probability Distributions Each value of the random variable has an assigned probability. The sum of all the assigned probabilities must equal 1.
Probability Distribution Features Since a probability distribution can be thought of as a relative-frequency distribution for a very large n, we can find the mean and the standard deviation. When viewing the distribution in terms of the population, use µ for the mean and σ for the standard deviation.
Means and Standard Deviations for Discrete Probability Distributions
Linear Functions of Random Variables Let a and b be constants. Let x be a random variable. L = a + bx is a linear function of x.
Independent Random Variables Let x1and x2be random variables. Then the random variables are independent if any event of x1 is independent of any event of x2.
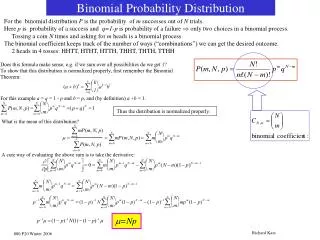
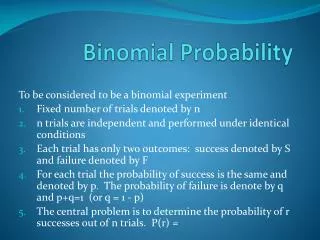
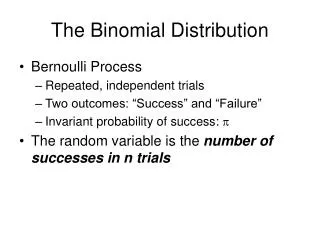
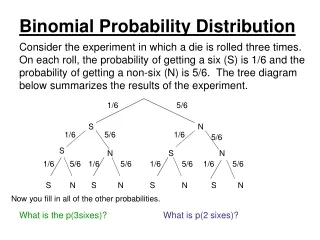
Binomial Experiments There are a fixed number of trials. This is denoted by n. The n trials are independent and repeated under identical conditions. Each trial has two outcomes: S = success F = failure
Binomial Experiments For each trial, the probability of success, p, remains the same. Thus, the probability of failure is 1 – p = q. The central problem is to determine the probability of r successes out of n trials.
Determining Binomial Probabilities Use the Binomial Probability Formula. Use Table 3 of Appendix II. Use technology.
Using the Binomial Table Locate the number of trials, n. Locate the number of successes, r. Follow that row to the right to the corresponding p column.
Recall for the sharpshooter example, n = 8, r = 6, p = 0.7 So the probability she hits exactly 6 targets is 0.296, as expected
Binomial Probabilities At times, we will need to calculate other probabilities: P(r < k) P(r ≤ k) P(r > k) P(r≥ k) Where k is a specified value less than or equal to the number of trials, n.
Critical Thinking Unusual values – For a binomial distribution, it is unusual for the number of successes r to be more than 2.5 standard deviations from the mean. – This can be used as an indicator to determine whether a specified number of r out of n trials in a binomial experiment is unusual.
Quota Problems We can use the binomial distribution table “backwards” to solve for a minimum number of trials. In these cases, we know r and p We use the table to find an n that satisfies our required probability.
The Geometric Distribution Suppose that rather than repeat a fixed number of trials, we repeat the experiment until the first success. Examples: Flip a coin until we observe the first head Roll a die until we observe the first 5 Randomly select DVDs off a production line until we find the first defective disk
The Poisson Distribution This distribution is used to model the number of “rare” events that occur in a time interval, volume, area, length, etc… Examples: Number of auto accidents during a month Number of diseased trees in an acre Number of customers arriving at a bank
Finding Poisson ProbabilitiesUsing the Table We can use Table 4 of Appendix II instead of the formula. Find λ at the top of the table. Find r along the left margin of the table.
Using the Poisson Table Recall, λ = 4 r = 0 r = 4 r = 7