0 likes | 1 Vues
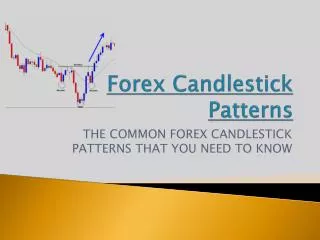
Get to know about 5 powerful bearish candlestick patterns that help identify trend reversals and improve your trading accuracy.
E N D
Search... Courses Webinars Stories Language GET FREE COURSE BASIC FINANCE DERIVATIVES FINANCIAL PLANNING FUNDAMENTAL ANALYSIS TECHNICAL ANALYSIS MUTUAL FUNDS MARKETSHALA MISCELLANEOUS Home Technical Analysis 5 Powerful Bearish Candlestick Patterns by Vivek Bajaj — June 23, 2025 in Technical Analysis, Charts, Patterns & Indicators 8 Reading Time: 9 mins read 134k VIEWS Share on Facebook Share on X Share on WhatsApp Key Takeaways: 1. Hanging Man signals a potential bearish reversal at the top of an uptrend, showing increased selling pressure. 2. Dark Cloud Cover forms when a bearish candle opens above and closes deep into the prior bullish candle, indicating a shift in sentiment. 3. Bearish Engulfing occurs when a large red candle completely engulfs the previous green one, suggesting strong bearish control. 4. Evening Star is a three-candle reversal pattern that indicates buyer exhaustion and the start of a downtrend. 5. Three Black Crows consist of three long bearish candles in a row, reflecting sustained selling pressure and trend reversal confirmation. After having a basic understanding of candlestick chart patterns, let’s dive into Bearish Candlestick Patterns that indicate the ongoing uptrend which is going to end and it may reverse to the downtrend. These Bearish Reversal Candlestick Patterns can be single or multiple candlestick patterns. One should note that: Bearish reversal patterns should form at the end of an uptrend. Otherwise, it will act just like a continuation pattern. One should confirm the reversal signals given by bearish reversal patterns with other indicators such as volume and resistance.
Table Of Contents Key Takeaways: 1. Hanging Man 2. Dark Cloud Cover 3. Bearish Engulfing 4. The Evening Star 5. The Three Black Crows What are bearish candlestick patterns? What is the 3 candle rule in trading? How can you tell if a candle is bearish? In this blog, we will be discussing 5 Powerful Bearish Candlestick Patterns: 5 Powerful Bearish Candlestick Patterns 1. Hanging Man
Hanging man is a bearish reversal candlestick pattern having a long lower shadow with a small real body. Appearing at the end of the uptrend, this bearish candlestick pattern indicates weakness in the ongoing price movement and shows that the bulls have pushed the prices up but they are not able to push further. It has a small real body which indicates a small distance between the opening and closing price. The lower shadow should be twice the length of its body and there is no upper shadow. This pattern helps the traders to square their buy position and enter a short position. Below is an example of the formation of the Hanging Man on the Daily chart of Nifty 50 below: 2. Dark Cloud Cover Dark Cloud Cover is a bearish reversal candlestick pattern formed at the end of an uptrend and indicating weakness in the uptrend. This candlestick pattern is made of two candlesticks, the first being a bullish candlestick and the second one being a bearish candlestick. As the prices rise, this pattern becomes important for the reversal to the downside. Below is an example of the Dark Cloud Cover in the daily chart of Sun Pharmaceutical Industries Ltd. 3. Bearish Engulfing The bearish engulfing pattern is the bearish reversal pattern which signals a reversal of the uptrend and indicates a fall in prices due to the selling pressure exerted by the sellers when it appears at the top of an uptrend. This pattern triggers a reversal of the ongoing uptrend as sellers enter the market and make the prices fall. The pattern is formed by two candles with the second bearish candle engulfing the ‘body’ of the previous green candle.
Learn how to trade with bearish and bullish engulfing patterns Below is an example of the Bearish Engulfing pattern as shown in the daily chart of Reliance Industries: 4. The Evening Star An Evening Star is a candlestick pattern that is used by traders for analyzing when the uptrend is going to reverse to a downtrend. This candlestick pattern consists of three candlesticks: a large bullish candlestick, a small- bodied candle, and a bearish candlestick. Evening Star patterns appear at the top of the uptrend and signal that the uptrend is going to reverse to a downtrend Below is an example of the Evening Star pattern formed in the Nifty 50 chart below: 5. The Three Black Crows Three Crows pattern is a multiple candlestick pattern that is used for predicting the reversal of the downtrend from the uptrend. It is formed when the sellers exert bearish forces and make the prices fall for three consecutive days. Traders can take a short position after the bearish candlestick pattern is formed. Traders should take the help of volume and technical indicators to confirm the formation of this candlestick pattern. Below is an example of the daily chart of Phillips Carbon Black Ltd. that the Three Black Crows Candlestick pattern :
To know about other candlesticks, read our blog on All 35 Candlestick Chart Patterns in the Stock Market-Explained Bottomline Hanging man is a bearish reversal candlestick pattern having a long lower shadow with a small real body. Dark Cloud Cover is a bearish reversal candlestick pattern formed at the end of an uptrend and indicating weakness in the uptrend. The bearish engulfing pattern is the bearish reversal pattern that signals a reversal of the uptrend and indicates a fall in prices due to the selling pressure exerted by the sellers when it appears at the top of an uptrend. An Evening Star is a candlestick pattern that is used by traders for analyzing when the uptrend is going to reverse to a downtrend. Three Crows pattern is a multiple candlestick pattern that is used for predicting the reversal of the downtrend from the uptrend. To learn more about these patterns in detail, refer to our technical analysis PDF. Visit us: https://blog.elearnmarkets.com/5-powerful-bearish-candlestick-patterns/ Frequently Asked Questions (FAQs) What are bearish candlestick patterns? On price charts, bearish candlestick patterns are formations that suggest future declines in the market. They offer visual indicators of the mood of the market and possible price movement, indicating that there is a good chance the asset’s price will drop. What is the 3 candle rule in trading? A big down candle, a smaller up candle enclosed in the previous candle, and then another up candle that closes above the close of the second candle make up the bullish reversal pattern known as the “three inside up pattern.” How can you tell if a candle is bearish? When sellers outweigh purchasers during an uptrend, a bearish engulfing pattern forms. A long red (black) real body swallowing a small green (white) real body reflects this action. The trend suggests that sellers are in charge again and that the price may drop further. Tags: basic bearish reversal candlesticks candlestick beginners guide candlestick pattern Share Tweet Send Previous Post Next Post
5 Powerful Bullish Candlestick Patterns How can we earn Rs 500 from the Stock Market daily? Vivek Bajaj Mr. Vivek Bajaj has over 18 years of trading experience in equities, options, currencies, and commodity markets. He is the co-founder of Stockedge and Elearnmarkets and is passionate about data, analytics, and technology. He serves on various exchange committees and has played a significant role in the evolution of India's derivative market. He has been a speaker at various colleges and higher institutions, including IIT and IIMs. Related Posts TECHNICAL ANALYSIS TECHNICAL ANALYSIS What is Slippage in Trading? Meaning & Examples Top 5 Breakout Trading Strategies MARCH 12, 2025 1.4K MARCH 28, 2025 399 TECHNICAL ANALYSIS TECHNICAL ANALYSIS 5 Stocks to Buy Today That Could Beat the NIFTY in 2025! What is a Margin Trading Facility? Advantages & Risks MAY 5, 2025 478 APRIL 4, 2025 879 Comments 8 4 years ago Samer Great! Reply 4 years ago Sakshi Agarwal Hi, Thank you for reading our blog!! Keep Reading! Reply 4 years ago Jai very nice Reply 4 years ago Sakshi Agarwal Hi, We are glad that you liked our post, you can read more blogs on Technical Analysis from here. Thank you for Reading! Reply
4 years ago Jigar Jani Great explanation Thanks ?? Reply 4 years ago Sakshi Agarwal Hi, We really appreciated that you liked our blog. Keep Reading! Reply 3 years ago santhosh Basic & very strong cocnept Reply 3 years ago Sakshi Agarwal Hi, We really appreciated that you liked our blog! Thank you for your feedback! Keep Reading! Reply Leave a Reply Your email address will not be published. Required fields are marked * Comment * Name * Email * POST COMMENT Disclaimer Elearnmarkets (Kredent InfoEdge Pvt. Ltd.) is a SEBI-registered Research Analyst (RA) entity (SEBI Registration No.: INH300007493). The information provided in this article is for educational and informational purposes only and should not be considered as an offer to buy or sell any securities or investment products. The stocks, securities, and investment instruments mentioned herein are not recommendations under SEBI (Research Analysts) Regulations, 2014. Readers are advised to conduct their own due diligence and seek independent financial advice before making any investment decisions. Investments in securities markets are subject to market risks. Please read all related documents carefully before investing. Investing in Equity Shares, Derivatives, Mutual Funds, or other instruments carry inherent risks, including potential loss of capital. Elearnmarkets (Kredent InfoEdge Pvt. Ltd.) does not provide any guarantee or assurance of returns on any investments. Past performance is not indicative of future performance. Register on Elearnmarkets Categories Continue your financial learning by creating your own account on Elearnmarkets.com Basic Finance Derivatives
Follow Us Financial Planning REGISTER FREE ACCOUNT Fundamental Analysis Download App Technical Analysis Mutual Funds Miscellaneous Popular On Elearnmarkets Market Superheroes: Vivek Bajaj Chetan Panchamia Ashish Kyal Premal Parekh Abhijit Paul Jegan Sivakumar Jayachadran Jyoti Budhia Vivek Gadodia Vishal Mehta Piyush Chaudhry Santosh Pasi Gomathi Shankar Courses: Options Trading Dow Theory Momentum Trading Stock Investing Harmonic Chart Patterns Algo Trading Elliot Wave Theory Advanced Excel Cryptocurrency NSE Certification Course Webinars: Bank Nifty Scalping Intraday Trading Strategies Options Trading Strategies Options selling Price Action Relative Strength Tax Planning Options Buying Growth Stocks Portfolio Management Risk Management Renko Charts Crude Oil Traders Psychology Moving Average Multibagger Stocks Free Learning Modules: Intraday Trading Options Scalping Swing Trading Financial Modelling RSI Indicator Bollinger Bands Pricing of Futures Personal Finance Initial Public Offerings (IPO) Value Investing Technical Indicators Candlesticks Chart Patterns Option Greeks ELSS Funds Banking and Insurance Real Estate Gold Book Summaries: Rich Dad Poor Dad Psychology of Money The Intelligent Investor The Richest Man in Babylon Think and Trade Like a Champion Value Investing and Behavioural Finance Trading in the Zone Learn to Earn Tools: CAGR Calculator SIP Calculator eLearnOptions Future Value Calculator Present Value Calculator Atal Pension Yojana Cost of Delay Calculator Become a Crorepati Visit Elearnmarkets Courses Webinars Financial Guides Get Free Counselling © 2025 Elearnmarkets. All Rights Reserved