GrADS for Beginners
GrADS for Beginners. Bob Kuligowski NOAA/NESDIS/STAR May 28, 2009. Outline. What is GrADS and how do I get it? GrADS essentials Getting started Gridded data sets Displaying data Script language Saving your plots GrADS-related resources. What is GrADS?.

GrADS for Beginners
E N D
Presentation Transcript
GrADS for Beginners Bob Kuligowski NOAA/NESDIS/STAR May 28, 2009
Outline • What is GrADS and how do I get it? • GrADS essentials • Getting started • Gridded data sets • Displaying data • Script language • Saving your plots • GrADS-related resources
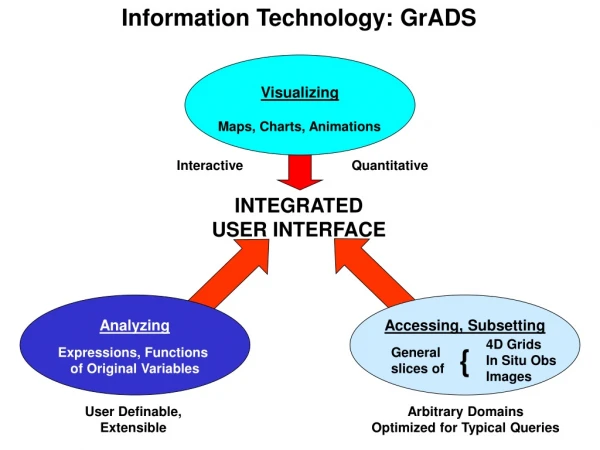
What is GrADS? • Grid Analysis and Display System • Developed at the Center for Ocean-Land-Atmosphere Studies (COLA) • Used for displaying and manipulating earth science data • Binary, GRIB, NetCDF, HDF-SDS • Station data (contours / grid boxes) and gridded data • Line and bar graphs, scatter plots, streamlines, wind vectors
How do I Get GrADS? • GrADS home page with FREE downloads: http://www.iges.org/grads/ • Latest version (GrADS 2.0.a5) runs on • Linux • Mac OS X • Older versions available for • SUN, SGI/IRIX, DEC, IBM/AIX • Installation details are left to the user and /or friendly neighborhood sysadmin
GrADS Essentials: Getting Started • Type grads (there are a bunch of arguments you can use, but we won’t get into them here) • You will be prompted for landscape mode; ‘no’ will get portrait mode (shown) • Your work areas will consist of a display screen and the window where you executed GrADs, which is where you type your commands • (note: all examples are from the Linux version; I can’t vouch for the others) • To exit, type quit
Gridded Data Sets: File Specs File name (^ means current directory) • GrADS descriptor files (*.ctl) contain the basic information on a data file: dset ^model.grb title "Sample Model Data for GrADS Tutorial“ undef 1e+20 dtype grib index ^model.gmp xdef 72 linear 0.000000 5.000000 ydef 46 linear -90.000000 4.000000 zdef 7 levels 1000 850 700 500 300 200 100 tdef 5 linear 0Z2jan1987 1dy vars 8 ps 0 1, 1, 0, 0 Surface pressure [hPa] u 7 33,100 Eastward wind [m/s] v 7 34,100 Northward wind [m/s] z 7 7,100 Geopotential height [m] t 7 11,100 Air Temperature [K] q 7 51,100 Specific humidity [kg/kg] ts 0 11,105, 2 Surface (2m) air temperature [K] p 0 59, 1, 0, 0 Total precipitation rate [kg/(m^2*s)] endvars Description “Undefined” (i.e., ignored) value Data type grib and grib2 formats require an index file with additional information (can greate using gribmap or grib2map in GrADS)
Gridded Data Sets: Grid Specs • GrADS descriptor files (*.ctl) contain the basic information on a data file: dset ^model.grb title "Sample Model Data for GrADS Tutorial“ undef 1e+20 dtype grib index ^model.gmp xdef 72 linear 0.000000 5.000000 ydef 46 linear -90.000000 4.000000 zdef 7 levels 1000 850 700 500 300 200 100 tdef 5 linear 0Z2jan1987 1dy vars 8 ps 0 1, 1, 0, 0 Surface pressure [hPa] u 7 33,100 Eastward wind [m/s] v 7 34,100 Northward wind [m/s] z 7 7,100 Geopotential height [m] t 7 11,100 Air Temperature [K] q 7 51,100 Specific humidity [kg/kg] ts 0 11,105, 2 Surface (2m) air temperature [K] p 0 59, 1, 0, 0 Total precipitation rate [kg/(m^2*s)] endvars Zonal and meridional grid specs: number of grid boxes, increment type, minimum, resolution Vertical grid: number of levels, increment type, pressure levels Time grid: number of time periods, increment type, minimum, resolution
Gridded Data Sets: Data Specs • GrADS descriptor files (*.ctl) contain the basic information on a data file: dset ^model.grb title "Sample Model Data for GrADS Tutorial“ undef 1e+20 dtype grib index ^model.gmp xdef 72 linear 0.000000 5.000000 ydef 46 linear -90.000000 4.000000 zdef 7 levels 1000 850 700 500 300 200 100 tdef 5 linear 0Z2jan1987 1dy vars 8 ps 0 1, 1, 0, 0 Surface pressure [hPa] u 7 33,100 Eastward wind [m/s] v 7 34,100 Northward wind [m/s] z 7 7,100 Geopotential height [m] t 7 11,100 Air Temperature [K] q 7 51,100 Specific humidity [kg/kg] ts 0 11,105, 2 Surface (2m) air temperature [K] p 0 59, 1, 0, 0 Total precipitation rate [kg/(m^2*s)] endvars Number of variables in file List of variables: name used by GrADS, number of vertical levels, units (used only for grib; use 99 otherwise), description End of variable listing
Displaying Data: Default Display • From the control file on the previous slides, a default display can be created using simply : > open model.ctl > d ps Open the GrADS control file Plot the pressure (‘ps’) field
Displaying Data: Cross Section • We can also modify the area of interest: > clear > set lon -180 0 > set lat 40 > set lev 500 > set t 1 > d z Clear the display Subset lon.=180 W to 0 W, lat.=40 N, 500 hPa, time=1 Plot the height (‘z’) field
Displaying Data: Multivariate Cross Section • We can also display multiple variables on a field: > clear > set lon -90 > set lat -90 90 > set lev 1000 100 > set t 1 > d t > d u Subset lon.=90 W, lat.=90 S to 90 N, height=1000-100 hPa, time=1 Plot the temperature (‘t’) field followed by the height (‘u’) field
Displaying Data: Graphics Types • GrADS can produce numerous types of file displays using gridded data using set gxout:
Displaying Data: Wind Vectors • Example of plotting wind vectors: > clear > set gxout vector > d u;v Graphics output type=vector Plot both zonal (‘u’) and meridional (‘v’) components of wind
Displaying Data: Grid Values • Example of plotting actual grid point values: > clear > set gxout grid > d u Graphics output type=grid
Displaying Data: Other Projections • We can also display the data in other projections using the set mproj command: • Default is latlon • set mproj off turns off the map projection
Displaying Data: Other Projections • Example of plotting in polar stereo: > clear > Set lon -140 -40 > Set lat 15 80 > set mpvals -120 -75 25 65 > set mproj nps > set gxout contour > set cint 30 > d z Reference values (Polar Stereographic only): plots 120 to 75 W and 25 to 65 N Contour interval=30
GrADS Script Language • The script language has all the basics you would expect from a programming language: • Variables • Assignments • Operators • Functions • File input / Output • Screen input / Output • If-then structures • Loops • Comments • Note that multiple GrADS commands can be placed on the same line if separated by a semicolon.
GrADS Script Language: Variables • Script variables are always treated like strings but can be operated on like numbers • Arithmetic operations are done in floating point but are expressed as integers if the result is integral • Variable names can be 1-8 characters long • Alphanumeric characters ONLY • Must start with a letter • Case sensitive • No variable declaration statements • GrADS allows for arrays using the syntax varname.i.j (e.g., for a 2-D array), where i and j must be integers.
GrADS Script Language: Assignments • It’s as easy as: variable=expression • Where expression can be a number, variable, or a combination of both with appropriate operators
GrADS Script Language: Operators • GrADS uses most standard operators: • Operations follow a fairly standard precedence level, and parentheses are available when in doubt…
GrADS Script Language: Functions • GrADS has a number of useful intrinsic functions, but you can also make your own (though they have to be part of the script at this time—no include statements) • strlen(string) returns string length • sublin(string,n) returns line n from a multi-line string • subwrd(string,n) returns the nth word from a string • substr(string,start,length) returns a sub-string of length length starting at character start
GrADS Script Language: File I/O • GrADS can read and write to ASCII files: • variable=read(filename) reads a file • Resulting string contains two lines (use var2=sublin(variable,n) to separate): • First line (n=1) is return code (0=OK) • Second line (n=2) is record read from file • retcode=write(filename, record, <append>) variable writes to a file • First use opens the file in write mode—will destroy an existing file if append argument not included! • retcode=close(filename) closes or rewinds a file • The retcode is a return code that GrADS gives when a file is written to or closed. As with read, the first line (sublin) is 0 if it wrote / closed successfully. • Note that there is no open statement in GrADS; a file is opened when the first read or write occurs.
Advanced File I/O • If you want to save your data in standard GrADS format (real*4 binary, bottom to top, left to right), you can do that using fwritefname with the following options: • Note: GrADS 2..0.a5 and after can also produce GeoTIFF and TIFF with KML reference files (i.e., for Google Earth)—see documentation for details.
GrADS Script Language: Screen I/O • Screen output is handled by one of two commands: • say expression • prompt expression • Both are written to the terminal; prompt does not put a carriage return after expression • User input is handled by • pullvariable • Execution is paused until user input (with a carriage return) occurs, and the input is assigned to variable
GrADS Script Language: If-Then Structures • GrADS uses a basic IF/ELSE/ENDIF construct • if (expression) is not accompanied by then • else cannot have additional conditions (i.e., no else if) • endif is the end of the block
GrADS Script Language: Loops • Loops are handled by the while / endwhile combination • while (expression) uses expression as the condition for the loop to be executed • endwhile expressionmarks the end of the loop • Since a counter is not part of the while expression, you will need to include a counter in the while loop
GrADS Script Language: Comments • An asterisk (*) at the beginning of a line indicates a comment. • If you want to comment the end of a line, use a semicolon followed by an asterisk.
Saving Your Plots • GrADS graphic output can be written to GrADS metafiles (.gmf) by using the following commands before any display commands: • ‘enable print file.gmf’ (opens the .gmf file) • And the following commands after any display commands: • ‘print’(performs the actual dump to the .gmf file) • ‘disable print’(closes the .gmf file) • You can view the files outside GrADS using • gxtran –i fname (but for reasons I don’t understand, this just opens the window. You need to hit <Enter> to put up the display; hitting <Enter> again exits.)
Saving Your Plots • GrADS supports several commands (run outside GrADS) to convert the .gmf file to other formats: • gxps –i fname.gmf –o fname.ps(PostScript) • gxeps–i fname.gmf –o fname.eps (Encapsulated PostScript) • gxpng–i fname.gmf –o fname.png (.png format, but can also create a .gif using the –gif option)
GrADS-Related Resources • The GrADS Documentation Page is a great resource: http://www.iges.org/grads/gadoc/ • Especially useful are the quick references cards for GrADS commands and the scripting language at the bottom of the page! • You can also subscribe to the GrADS Users Group (more info at http://www.iges.org/grads/users.html)