world map evolution (i)
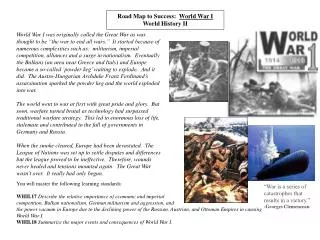
Evolution of the World Map. A Antiquity. B Middle Ages. C Age of Discovery. D Modern Era ... Creation of the first accurate world maps. Central America, 1514 ...

world map evolution (i)
E N D
Presentation Transcript
GEOGRAPHY 1001 – INTRODUCTION TO GEOGRAPHY Joseph Naumann -- UMSL Evolution of the World Map A – Antiquity B – Middle Ages C – Age of Discovery D – Modern Era
Antiquity • Herodotus (circa 450 BC) • Inspired by Pythagoras (530 BC) and his geometry. • Father of geography. • Basic physical and human geography. • Exploration and travel instead of geometry. • Coined the terms Europe, Asia and Africa (Libya).
Antiquity Frigid • Aristotle (circa 350 BC) • Considered physical elements such as the temperature and winds as factors of the human habitat. • Division of the world in 3 climatic zones. • Relationships between the environment (temperature) and human habitat. • One of the first physical geographer. Ekumene Torrid Equator
Antiquity • Eratosthenes (circa 250 BC) • Formally assumed the earth was round. • Calculated the circumference of the earth. • 40,572 km versus the exact figure of 40,091 km. • Developed the concepts of parallel and meridian. • Consequently introduced the concept of geographical location. • Created modern cartography (cartographic plane).
Antiquity • Ptolemy (circa 150 AD) • Refined the coordinate system. • Inventory of population and resources. • Describing the world. • 8,000 entries. • Relationships between the physical and human elements. • Created map projections.
Middle Ages • Period of decline • The cartographic and regional approach was lost in Europe. • Representation of the world was “Christianized”. • Orthodoxy replaced objective observation and analysis. • “T and O” Maps. • Greek and Roman knowledge kept by the Byzantine Empire and by the Arabs.
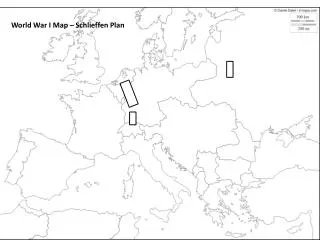
Age of Discovery • Exploration and innovation • The 15th and 16th centuries were characterized by numerous maritime explorations. • A commercial expansion of European nations. • Several technical innovations. • The compass, more precise maps. • Larger ships (they passed from 200 to 600 tons during the sixteenth century), better ship structures and the rudder. • Insure a safe, fast and therefore profitable maritime navigation. • Creation of the first accurate world maps.
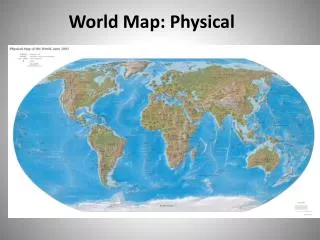
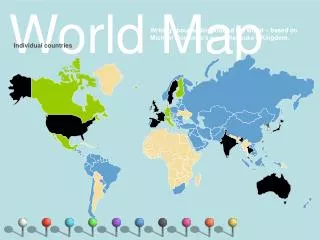
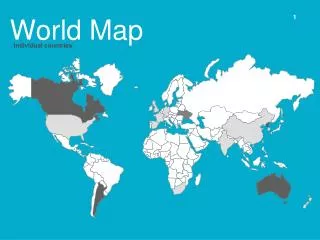
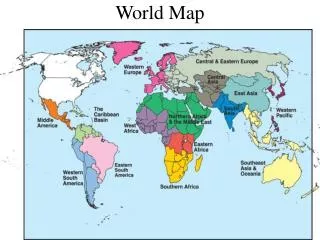
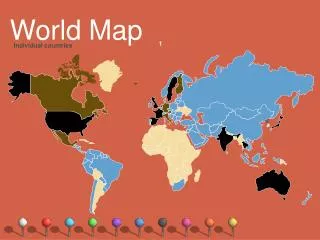
Modern Era • A complete world map • Early 20th century. • Complete and accurate view of the world. • Coordinate systems. • National inventories of resources. • Information technologies • Use of remote sensing (aerial photographs and remote sensing). • G.I.S. & Digital maps.
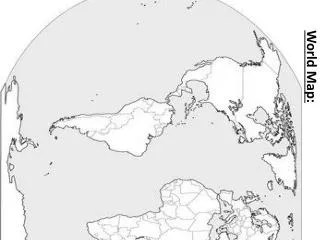
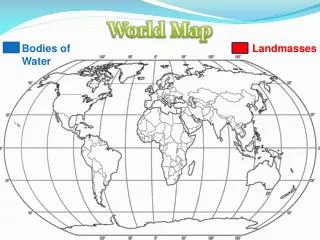
Problem of Distortion • All maps, by their very nature contain some type of distortion. • Converting a 3-dimensional spherical surface to a 2-dimensional “flat” surface.
Essentials of a good map • Title – view knows what to expect • Grid – allows for easy, accurate locating • Direction arrow or compass rose – to orient the map to reality • Scale – to allow one to relate distances on the map to the actual distances on the earth. • Key or Legend – so the viewer can understand what the symbols and colors represent.