Download
1 / 14
140 likes | 168 Vues
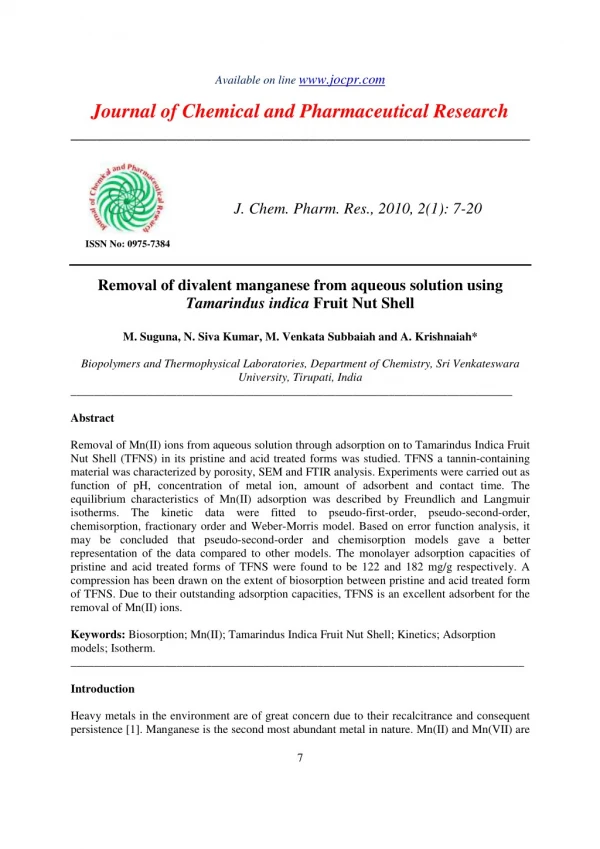
Removal of Mn(II) ions from aqueous solution through adsorption on to Tamarindus Indica Fruit Nut Shell (TFNS) in its pristine and acid treated forms was studied. TFNS a tannin-containing<br>material was characterized by porosity, SEM and FTIR analysis. Experiments were carried out as function of pH, concentration of metal ion, amount of adsorbent and contact time. The equilibrium characteristics of Mn(II) adsorption was described by Freundlich and Langmuir<br>isotherms. The kinetic data were fitted to pseudo-first-order, pseudo-second-order, chemisorption, fractionary order and Weber-Morris model. Based on error function analysis, it<br>may be concluded that pseudo-second-order and chemisorption models gave a better<br>representation of the data compared to other models. The monolayer adsorption capacities of pristine and acid treated forms of TFNS were found to be 122 and 182 mg/g respectively. A compression has been drawn on the extent of biosorption between pristine and acid treated form<br>of TFNS. Due to their outstanding adsorption capacities, TFNS is an excellent adsorbent for the removal of Mn(II) ions. <br>

E N D
Available on line www.jocpr.com Journal of Chemical and Pharmaceutical Research ____________________________________________________ J. Chem. Pharm. Res., 2010, 2(1): 7-20 ISSN No: 0975-7384 Removal of divalent manganese from aqueous solution using Tamarindus indica Fruit Nut Shell M. Suguna, N. Siva Kumar, M. Venkata Subbaiah and A. Krishnaiah* Biopolymers and Thermophysical Laboratories, Department of Chemistry, Sri Venkateswara University, Tirupati, India ___________________________________________________________________________ Abstract Removal of Mn(II) ions from aqueous solution through adsorption on to Tamarindus Indica Fruit Nut Shell (TFNS) in its pristine and acid treated forms was studied. TFNS a tannin-containing material was characterized by porosity, SEM and FTIR analysis. Experiments were carried out as function of pH, concentration of metal ion, amount of adsorbent and contact time. The equilibrium characteristics of Mn(II) adsorption was described by Freundlich and Langmuir isotherms. The kinetic data were fitted to pseudo-first-order, pseudo-second-order, chemisorption, fractionary order and Weber-Morris model. Based on error function analysis, it may be concluded that pseudo-second-order and chemisorption models gave a better representation of the data compared to other models. The monolayer adsorption capacities of pristine and acid treated forms of TFNS were found to be 122 and 182 mg/g respectively. A compression has been drawn on the extent of biosorption between pristine and acid treated form of TFNS. Due to their outstanding adsorption capacities, TFNS is an excellent adsorbent for the removal of Mn(II) ions. Keywords: Biosorption; Mn(II); Tamarindus Indica Fruit Nut Shell; Kinetics; Adsorption models; Isotherm. _____________________________________________________________________________ Introduction Heavy metals in the environment are of great concern due to their recalcitrance and consequent persistence [1]. Manganese is the second most abundant metal in nature. Mn(II) and Mn(VII) are 7
A. Krishnaiah et al J. Chem. Pharm. Res., 2010, 2(1): 7-20 _____________________________________________________________________________ essential micronutrients for organisms and plants. However, they become toxic at higher levels. Manganese has variety of applications in ceramics, dry battery cells, electrical coils and many alloys [2]. In addition to the disposal of untreated discharge from the above applications into water, another major source of pollution of Mn is burning of coal and oil. Exposure to manganese causes neurotoxicity [3] low haemoglobin levels [4] and gastrointestinal accumulation [5]. Increased knowledge about toxicological effects of heavy metals on the environment is well recognized and therefore, it is imperative to search for multifarious methods to reduce water pollution [6, 7]. Among the many methods available for the removal of trace metals from water namely: chemical precipitation, ion exchang, electrochemical treatment, coagulation, solvent extraction and membrane process. But these techniques have limitations [8] and often are neither effective nor economical especially for the removal of heavy metals at low concentrations. Biosorption offers the advantages of low operating cost, minimization of volume of chemical and/or biological sludge to be disposed, high efficiency in detoxifying effluents and no nutrient requirement [9]. Biosorption is a fast and reversible uptake of the heavy metals with micro organisms or biomass. Numerous biological low-cost adsorbents have been tested for the removal of toxic metal ions from aqueous solutions over the last two decades [10,11]. The by-product obtained from biomaterial production is a cheap source of biosorbents. Tamarind is marketed in India in the form of pulp of ripe fruit from which seeds have been removed [12]. This seed is considered as a waste product and can be acquired at a low price [13]. The seed testa contains 40% of water soluble carbohydrates and pectins and 60% tannins and colouring matter [14]. The testa is considered to be structurally related to flavonoids and condensed proanthocyanidins. Thus the testa is prone to oxidation and undergoes progressive polymerization under acidic conditions [15]. Randall and Vazquez reported that certain groups of tannins present in the testa are the active species in the adsorption process [16,17]. Srinivasa Rao studied the adsorption of Cr(VI) ions from aqueous solutions on crude tamarind fruit shell, HCl and oxalic acid treated shells [18]. Ajitha studied the adsorption of chromium, copper and nickel ions by tamarindus indica fruit nut testa [19]. Removal of Pb(II) through adsorption by carbonized tamarind seeds and seed coats was reported by Nagarajan and Prabhavathi [20]. Agawaral studied the biosorption of aqueous chromium (VI) by Tamarindus seeds [21]. Only problem with tannin-containing materials is discoloration. This was overcome by washing the material several times with double distilled water. The acid treatment of the testa instantaneously resulted in the loss of colour as well as an increase in adsorption capacity. The present study aims at investigating the biosorption of manganese (II) on Tamarindus Indica Fruit Nut shell (TFNS), and HCl treated nut shell and compare their performance. The effect of contact time, solution pH, concentration of metal ions and amount of biomass on the extent of adsorption are also studied and compared. The kinetic data are fitted to pseudo-first-order, pseudo-second-order, chemisorption, fractionary order and Weber-Morris reaction kinetic models and the rate constants are evaluated. The equilibrium data are fitted to Langmuir and Freundlich isotherm models. Further the biosorbents are characterized by FTIR. 8
A. Krishnaiah et al J. Chem. Pharm. Res., 2010, 2(1): 7-20 _____________________________________________________________________________ Materials and methods Biosorbent Tamarind Fruit Nut Shells, a waste product of tamarind pulp, are used for the removal of Mn(II) ions from aqueous solutions. These tamarind fruit shells have been collected in Tirupati town, A.P., India, and are powdered and sieved to get uniform 60-80 mesh size particles were used. They are washed thoroughly with distilled water and dried in a oven for 2 hrs at 60oC. It is used as a biosorbent. Pre-treatment of the biosorbent The pre-treatment of tamarind nut shells is carried out to increase the metal uptake. About 10 g of the tamarind shells are treated with 100 mL of 1N HCl for 24hrs and kept on water bath (70oC) for half an hour. It is cooled and neutralized with 1N NaOH. The filtrates are separated and are dried in an oven for four hours at 60oC. Preparation of manganese solution A stock solution of Mn(II) is prepared by dissolving an accurate quantity of MnSO4.H2O (Merck Ltd., Germany). The stock solution of Mn(II) is prepared by dissolving 3.077 g of manganese sulphate monohydrate in 1 litre double distilled water which was contained 1 g/l of Mn(II) ion. The range of concentrations prepared from stock solutions has been varied from 100 to 400 mg/L. All chemicals were used of analytical grade obtained from Merck Ltd, Germany. Double distilled water was used in preparing the stock solutions and also throughout the experimental analysis. The initial pH adjustments were carried out either by HCl and NaOH. Batch studies 100 mg of biosorbent is suspended in 100 mL of metal solution taken in 125mL Erlenmeyer flasks and agitated at 150 rpm on a Lab line rotatary shaker. Samples are withdrawn at periodic intervals and filtered using Whatman No.1 filter paper. The concentration of Mn(II) remaining in the filtrate is analyzed by UV Visible Spectro-photometer (Elico-SL 177) at 545 nm. The effect of contact time, metal ion concentration, adsorbent dose and effect of pH are studied. The amount adsorbed per unit mass of adsorbent (Qe) is obtained using the following equation. − C C (1) i e = Q v e m where Qe (mg/g) is the adsorption capacity at equilibrium, Ci and Ce denote respectively the initial and equilibrium concentrations of Mn(II), and m is the mass of the adsorbent. The effect of pH on adsorption was studied by carrying out the experiment at different pH values, keeping the concentration, volume of adsorbate solution and amount of adsorbent constant. The effect of adsorbent dose on adsorption of Mn(II) was studied by agitating 100 mL of 100 mg/L metal solution with different amounts of adsorbent. Statistical evaluation of the kinetic parameters The Marquardt’s percent standard deviation (MPSD) error function [22] is employed in this study to find out the suitable kinetic model to represent the experimental data. The MPSD error function has been used previously by a number of researchers in the field [7] 9
A. Krishnaiah et al J. Chem. Pharm. Res., 2010, 2(1): 7-20 _____________________________________________________________________________ 2 − q q p 1 − ∑ ( ) mod exp i el q i = % 100х . F (2) error 1 p i exp i where, qimodel is each value of q predicted by the fitted model and qi exp is each value of q measured experimentally and p is the number of experiments performed. Results and Discussion Characterization of the biosorbent Porosity Porosity is one of the factors that influence the chemical reactivity of solids and physical interaction of solids with liquids and gases. Percent porosity is measured by taking one gram of the biosorbent and these values are presented in Table 1. Acid treated biosorbent showed higher percent porosity, which means that more pores are available for adsorption of metal ions after the acid treated biosorbent. Thus porosity is one of the characteristics that decide the strength of the adsorbent to absorb the adsorbate. Table 1: Porosity of biosorbent Biosorbent Pore volume 0.19 0.22 Pore density g/cc 5.26 4.48 % porosity 28.00 33.70 Pristine Tamarindus fruit nut shell Acid treated Tamarindus fruit nut shell Fourier Transform Infrared (FTIR) Studies Numerous chemical functional groups such as hydroxyl, carboxyl, amine, sulfonic, ester, etc. are identified as potential adsorption sites to be responsible for binding metallic ions to TFNS. FTIR spectra given in Fig. 1, show peaks at 3330-3382 cm-1 indicating the stretching of O-H group of macro molecular association [23], the band at 2921 cm-1 assigned to stretching of -CH2- bond of methylene groups and the weak band at 2853 cm-1 [24] is assigned to -CH- bond of methylene group present in TFNS [23,24]. The sharp peaks observed at 1526 and 1443 cm-1 in Figure 1a and Figure1c are assigned to C=C ring stretch of aromatic rings [23], but these peaks are absent in the acid treated forms(Fig.1b, Fig.1d).This indicates that there is a possibility of ring cleavage after pretreatment of biosorbent. Thus the binding capacity of the acid treated forms is higher than the untreated form. According to Huang and Huang, acid treated biomass contained a higher percentage of surface nitrogen [24]. This indicates that acid treatment may dissolve polysaccharide compounds in the outer layer of the cell wall and produce additional binding sites. Acid treatment results in clean-up of the surface impurities, stabilization of the surface compounds, and increasing the surface area by opening the available sites for metal adsorption. 10
A. Krishnaiah et al J. Chem. Pharm. Res., 2010, 2(1): 7-20 _____________________________________________________________________________ Figure: 1 FTIR spectra of (a) Untreated TFNS (b) Treated TFNS (c) Mn(II) loaded on untreated TFNS (d) Mn(II) loaded on treated TFNS. Effect of pH Since the solution pH can significantly influence the removal of heavy metals. Experiments over a range of pH values (2-8) with 100 mg/L of Mn(II) solution are conducted. The result shown in Fig. 2 indicate that maximum uptake of Mn(II) ions takes place at pH 4 and decrease in adsorption capacity on either side of pH 4. To understand the adsorption mechanism, it is necessary to determine the pH at point of zero charge (pHpzc) of the adsorbent. Adsorption of cations is favoured at pH>pHpzc, while the adsorption of anions is favoured at pH<pHpzc. The value of pHpzc of tamarind seeds was 6. The surface charge of the Tamarind seed is positive up to pH range 6 and above pH 6 Tamarind seed would have a net negative charge [21]. Tamarind nut shells are a rich source of proteins and 11
A. Krishnaiah et al J. Chem. Pharm. Res., 2010, 2(1): 7-20 _____________________________________________________________________________ amino acids [25]. Some functional groups, such as amines, are positively charged when protonated and may electrostatically bind with negatively charged metal complexes. At lower pH, the biosorbent is positively charged due to protonation and metal complex exists as anion leading to an electrostatic attraction between them. As pH increases, deprotonation starts and thereby decrease in electrostatic force of attraction between the adsorbent and adsorbate ions. Hence adsorption capacity decreases. As the pH increases, the overall surface charge on tamarind seed became negative and biosorption decreased. Marathe have reported that tamarind seeds have excellent stability over acidic pH range [25]. 100 Adsorption capacity (mg/g) 90 Untreated TFNS Treated TFNS 80 70 60 50 40 30 20 10 0 0 2 4 6 8 10 pH Figure: 2 Effect of pH for adsorption of Mn(II) on pure and treated TFNS Effect of adsorbent dosage The effect of adsorbent dose on the extent of adsorption is studied and it is found that the extent of removal of metal ions increases with an increase in the amount of seed coat (Fig. 3). The removal efficiency increases up to an optimum dose, beyond which the increase in removal efficiency is negligible for a given initial concentration. This is to be expected because given fixed initial solute concentration, increasing the adsorbent dose provides greater surface area or adsorption sites. The results indicate that the tamarind seed coat in pristine and acid-treated forms removes 96% and 98% of Mn(II) respectively. 100 90 Untreated TNFS Treated TNFS 80 70 Percent removal 60 50 40 30 20 10 0 0 0.1 0.2 Amount of adsorbent dose (g) 0.3 0.4 0.5 0.6 Figure: 3 Effect of adsorbent dose on percent removal of Mn(II) on pure and treated TFNS 12
A. Krishnaiah et al J. Chem. Pharm. Res., 2010, 2(1): 7-20 _____________________________________________________________________________ Adsorption Kinetics First-order kinetics It should be emphasized that the nature of the metal-ion-sorbent interactions is likely to be different for different biosorbents so that biosorption of metal ions on a particular biosorbent could be a reaction kinetic controlled process, a diffusion controlled process or even a combination of both. Mn(II) adsorption data on TFNS and treated TFNS are fitted to pseudo- first-order rate expression as given by, k Q Q Q t − = − where Qe and Qt are the amounts of metal ion adsorbed per unit mass of adsorbent at equilibrium and at time t (min). k1 is the rate constant of adsorption. Values of k1 are presented in Tables 2 and 3. Table 2: Values of kinetic parameters for adsorption of Mn(II) on untreated TFNS (3) log( ) log 1 e t e 2.303 Initial concentration of Mn(II) mg/L Kinetic Model Parameter 100 0.018 0.901 59.9% 88.5% 200 0.015 0.990 300 0.015 0.979 93.6% 400 0.015 0.905 81.5% K1 R2 MPSD Pseudo-first-order K2 R2 Qe MPSD 0.0006 0.0006 0.997 86 4.4% 0.0006 0.999 256 2.9% 0.0006 0.999 371 8.7% 0.999 176 2.6% Pseudo-second- order 4.23×10⁶ 0.07 0.999 2.9×10³ 0.03 0.997 α (mg g-1 min-1) β (g/mg) R2 MPSD 67.36 0.092 0.996 8349.8 0.07 0.995 Chemisorption 2.8% 1.5% 1.8% 1.3% Kav(min-1) 0.001 23.73 0.5 0.969 85.2% 97.3% 0.001 25.11% 0.3 0.993 0.001 25.93 0.3 0.9724 0.001 65.24 0.4 0.9375 Qe n R2 MPSD Fractionary order 100.9% 94.7% Kid R2 C 2.483 0.944 45 2.924 0.957 130 3.309 0.951 213 8.069 0.930 245 Weber-Morris 13
A. Krishnaiah et al J. Chem. Pharm. Res., 2010, 2(1): 7-20 _____________________________________________________________________________ Table 3: Values of kinetic parameters for adsorption of Mn(II) on treated TFNS Initial concentration of Mn(II) mg/L Kinetic Model Parameter 100 0.01 0.928 200 0.015 0.939 300 0.01 0.954 400 0.013 0.952 K1 R2 MPSD Pseudo-first- order 81.8% 78.4% 97.9% 99.5% K2 R2 Qe MPSD 0.0005 0.991 101.00 0.0005 0.999 196 0.0005 0.998 286 0.0005 0.999 345 Pseudo- second-order 6.9% 3.2% 3.8% 3.1% α (mg g-1 min-1) β (g/mg) R2 MPSD 4188 6.37×10⁷ 3.83×10⁷ 114.43 0.08 0.899 0.06 0.9482 0.08 0.7709 0.06 0.9515 Chemisorption 3.3% 1.6% 1.2% 0.7% Kav(min-1) Qe (cal) n R2 MPSD 0.0007 22.93 0.5 0.9855 0.0009 33.61 0.3 0.9766 0.0007 27.49 0.2 0.9913 0.0008 27.21 0.1 0.9477 Fractionary order 100.9% 99.9% 103% 103.8% Kid R2 C 2.775 0.927 54.00 3.694 0.928 138 3.816 0.951 225 4.128 0.989 284 Weber-Morris Chemisorption The Elovich equation is for general application to chemisorption kinetics [26]. The equation has been applied satisfactorily to some chemisorption processes and has been found to cover a wide range of slow adsorption rates. The equation often valid for systems in which the adsorbing surface is heterogeneous, is represented as 1 1 ln( ) ln( ) β β where α is adsorption rate (mg/g/min) and β is related to the extent of surface coverage and the active energy involved in chemisorption (g/min). The plots of ln(t) vs Qt are presented in Figs. 4 and 5. The values of α and β for pristine and acid treated forms are given in Tables 2 and 3. = αβ + (4) t Q t 14
A. Krishnaiah et al J. Chem. Pharm. Res., 2010, 2(1): 7-20 _____________________________________________________________________________ 400 100mg/L 200mg/L 300mg/L 400mg/L 350 300 250 200 Q t 150 100 50 0 0 1 2 3 4 5 6 ln(t) Figure: 4 Elovich model for adsorption of Mn(II) on untreated TFNS. 400 100mg/L 200mg/L 300mg/L 400mg/L 350 300 250 200 Qt 150 100 50 0 0 1 2 3 4 5 6 ln (t) Figure: 5 Elovich model for adsorption of Mn(II) on treated TFNS Fractionary order Possible change of the adsorption rates as function of the initial concentration and the adsorption time, as well as the determination of fractionary kinetic orders, still lack in the kinetic adsorption models as reported in the literature. In this way, an alternative fractionary order kinetic equation proposed by Avrami [27] is used to analyze the data in the present study, α 1 exp[ ( )]n AV k t = − − where α is adsorption fraction (qt /qe) at time t, kAV is the Avirami kinetic constant (min-1) and n is a fractionary reaction order. The values are given Tables 2 and 3. 3.4.4. Second order kinetics Experimental data are also analyzed in terms of pseudo-second-order kinetic model which is given in the following equation, 1 1 t t Q k Q Q where k2 (g mg-1min-1) is the rate constant of the second-order equation, Qt (mg/g) is the amount adsorbed at time t (min) and Qe is the amount adsorbed at equilibrium (mg/g). This model is (6) = + (7) 2 e 2 t e 15
A. Krishnaiah et al J. Chem. Pharm. Res., 2010, 2(1): 7-20 _____________________________________________________________________________ more likely to predict the kinetic behaviour of adsorption with chemical sorption being the rate- controlling step. The rate constant (k2), calculated from the slopes of the plots of t/Qt vs. t along with correlation coefficients of the plots and the experimental and caluculated values of Qe are given in Tables 2 and 3. From Tables 2 and 3, it is observed that the experimental data are well fitted to pseudo-second- order kinetic and chemisorption kinetic models with low error function and high R2 values, for the four initial concentration levelsof the Mn(II) ions. The chemisorption model gives a better fit compared to the pseudo second-order kinetic model, since it presented lower error function values. It should be stressed that only the analysis of R2 values to establishment of a given model is not enough, because the error function evaluates the differences associated with each individual points fitted by the model in relation to each experimental point measured. This observation supports the contention that the adsorption of Manganese on TFNS follows pseudo- second-order kinetics and chemisorption models. The plots of time (min) Vs. t/Qt obtained for the adsorption of Mn(II) onto TFNS and pre-treated TFNS at different concentrations are shown in Figs. 6 and 7. 3 100 mg/L 200 mg/L 300 mg/L 400 mg/L 2.5 2 t/Qt 1.5 1 0.5 0 0 50 100 150 200 250 Time (min) Figure: 6 Second order kinetics for adsorption Mn(II) on untreated TFNS. 2.5 100mg/L 200mg/l 300mg/L 400mg/L 2 1.5 t/Qt 1 0.5 0 0 50 100 150 200 250 Time (min) Figure: 7 Second order kinetics for adsorption of Mn(II) on treated TFNS Weber-Morris method An intra particle diffusion model proposed by Weber and Morris can be written as follows: 16
A. Krishnaiah et al J. Chem. Pharm. Res., 2010, 2(1): 7-20 _____________________________________________________________________________ 1/2 = + (8) Q k t C t id where Qt (mg/L) is the amount adsorbed at time t (min), kid (mg g-1 min-1/2 ) is the rate constant of intraparticle diffusion. C is the value of intercept which gives an idea about the boundary layer thickness, i.e. the larger intercept; the greater is the boundary layer effect. The intra particle rate constant ki d (mg g-1 min-1/2) and intercept C (mg/g) are given in Tables 2 and 3. The linear plot of Qe vs. t1/2 with zero intercept indicates that intra particle diffusion alone determines the overall rate of adsorption. The plots are not passing through origin indicating that the intra particle diffusion is not the only rate determining factor. Adsorption isotherms Langmuir isotherms Langmuir model is often used to describe equilibrium adsorption data. This is valid for monolayer sorption on to a surface with a finite number of identical sites and is given by: o bC Q Q + where Qo is the maximum amount of the metal ion adsorbed per unit weight of TFNS to form a complete monolayer on the surfaces at equilibrium concentrations and b is related to affinity of the binding site. Qo and b are determined from the liner plots (Fig. 8) 1/Ce vs. 1/Qe. 0.18 =1 e (9) e bC e Untreated TFNS Treated TFNS 0.16 0.14 0.12 0.1 1/Qe 0.08 0.06 0.04 0.02 0 0 0.1 0.2 0.3 1/Ce 0.4 0.5 0.6 Figure: 8 Langmuir isotherms for adsorption of Mn(II) on pure and treated TFNS Table 4: Parameters of Langmuir and Freundlich Isotherms for adsorption of Mn(II) on pristine and acid treated TFNS. Langmuir Isotherm Constants Qo b Pristine Tamarindus fruit nut shell Acid treated Tamarindus fruit nut shell Freundlich Isotherm Constants Kf n Adsorbent R2 R2 122 0.0164 0.992 2.7 1.2 0.992 182 0.0218 0.999 4.6 1.2 0.999 17
A. Krishnaiah et al J. Chem. Pharm. Res., 2010, 2(1): 7-20 _____________________________________________________________________________ Langmuir constants, Qo and b, and correlation factor (R2) are presented in Table 4. The values of Qo appear to be significantly higher for Mn(II) on treated TFNS. Qo values for Mn(II) adsorption on different adsorbents, represented in the literature included in Table 5. Table 5: Maximum adsorption capacity Qo(mg/g) for adsorption of Mn(II) by various adsorbents Adsorbent Qo(mg/g) Granular activated carbon 2.5 Aspergillus Niger 19.3 Saccharomyce scerevisiae 18.9 Arthrobacter species 148.0 Cyanobacteriun Gloeothece manga 473–906 Pristine tamarindus nut shell 122.0 Acid treated tamarindus nut shell 182.0 Freundlich isotherms The widely used empirical Freudlich equation based on sorption on a heterogeneous surface is given by: 1 = e where, Kf and n are Freundlich constants, Kf and 1/n indicate the adsorption capacity and adsorption intensity, respectively. Higher the value of 1/n, higher will be the affinity between the adsorbate and the adsorbent and the heterogeneity of the adsorbent sites. Value of 1/n indicate the relative distribution of energy sites and depend on the nature and the strength of the adsorption process. Linear plots (Fig. 9) of log Ce vs. log Qe at different Mn(II) ion concentrations are applied to confirm the applicability of Freundlich isotherm. The values of Kf and n, and correlation coefficients (R2) are presented in Table 4. 2 Untreated TFNS Treated TFNS Reference [28] [1] [1] [29] [30] present Study Present Study Q K fC (10) n e 1.8 1.6 1.4 1.2 log Q e 1 0.8 0.6 0.4 0.2 0 0 0.2 0.4 0.6 0.8 1 1.2 1.4 1.6 1.8 log Ce Figure: 9 Freundlich isotherms for adsorption of Mn(II) on pure and treated TNFS 18
A. Krishnaiah et al J. Chem. Pharm. Res., 2010, 2(1): 7-20 _____________________________________________________________________________ Conclusion The results obtained in the present study show that tamarind fruit nut shells in its natural and acid treated forms are excellent biosorbents for the removal of Mn(II) ions. The maximum uptake of Mn(II) ions occurs at pH 4. Increasing the amount of biosorbent increases the percent removal of the metal ions. Further the biosorbents are characterized by FTIR spectral analysis. Based on the lower error function values the kinetic data were better fitted to pseudo-second-order kinetic model and chemisorption model, when compared to pseudo-first-order, fractionary order and Webber-Morris models. The data fits well to both Langmuir and Freundlich isotherms and the monolayer adsorption capacities of tamarind fruit nut shell and treated tamarind fruit nut shell are 122.0 mg/g and 182.0 mg/g respectively. The present study clearly demonstrates the potential of low cost biosorbent, tamarind fruit nut shell in pristine and acid treated forms, is a suitable alternative for the removal of Mn(II) ions from aqueous medium. References [1] K Parvathi; R Naresh Kumar; Nagendran. Biosorption of Manganese by Aspergillus and Saccharomyces Cerevisiae, Springer Science + Business Media B.V. 2006. [2] YC Sharma; SN Uma Singh; F Paras Gode. Chem. Eng. J.,2007, 132, 319-323. [3] GD Veliz; S Mors; P Gomez; MT Dossi; JC Montiel; C Arriagada; F Aboitiz; S Aguilar. Pharmacol Biochem., 2004, 77, 245-251. [4] CS Burgoa, C Rios, LA Mercado, SA Seranno, FC Valle, RAE Wynter, JLT Sangrador, JPV Barragan, YRS Agudelo, Montes, Environ. Res. 2001, 85, 90-104. [5] S Henrik; MD Thomsen; ODVM Svendsen; S Klastrup. Acad. Radiol. 2004, 11, 38-44. [6] AH Mahvi, D Naghipour, F Vaezi, S Nazmara, Am. J. Appl. Sci. 2005, 2, 372-375. [7] JCP Vaghetti; EC Lima; R Betina; MDC Bruna; FC Natali, LB Jorge; LPD Silvio. J. Hazard. Mater.2009, 162, 270-280. [8] G Ozdemir; N Ceyhan; T Ozturk; FT Akirmak; T Cosar. Chem. Eng. J., 2004, 102, 249-253. [9] W Jianlog; Z Xinmin; D Decai; Z Ding. J. Biotechnol., 2001, 87, 273-277. [10] S Babel; TA Kurniawan. J. Hazard. Mater., 2003, 97, 219-243. [11] TA Kurniawan; GYS Chan; WH Lo; S Babel. Sci. Total Environ. 2006, 366, 409-426. [12] MM Ishola; EB Agbaji; AS Agbaji. J. Sci. Food Agri., 1990, 51, 141-143. [13] S Bhattacharya; S Bal; RK Mukherjee; S Bhattacharya. J. Food Eng., 1997, 33, 129-138. [14] T Krishna Murthy, Minor forest products of India New Delhi: Oxford and IBH. 1993, 234- 335. [15] V Jeeva; P Devraj; R Lakshmi Devi; Sundaram. Economic Tamarindus-Promising tree for waste land development, In National symposium on Tamarindus indica, Tirupati, A.P., India, 1997, 141-143. [16] JM Randall; RL Bermann; V Garrett; AC Waiss Jr. J. Forest Products,1974, 24, 80-84. [17] G Vazquez; G Antorrena; J Gonzalez; MD Doval. Bioresource Technol., 1994, 48, 251-255. [18] P Srinivasa Rao; J Ajitha Priya; KVN Suresh Reddy; A Krishnaiah. Electron. J. Biotechnol., 2007, 10, 358-367. [19] J Ajitha Priya; G Sankara Reddy; VM Boddu; A Krishnaiah. Bioremediation J., 2008, 12, 145-155. [20] P Nagarajan; SP Prabhavathi. Indian J. Environ. Protection,2005, 5, 433-436. [21] GS Agarwal; HK Bhuptawat; S Chaudhari. Bioresource Technol., 2006, 97, 949-956. 19
A. Krishnaiah et al J. Chem. Pharm. Res., 2010, 2(1): 7-20 _____________________________________________________________________________ [22] HK Marquardt, J. Soc. Industrial Appl. Math. 1963, 11, 431-441. [23] DL Pavia; GM Lampman; GS Kriz. Introduction to Spectroscopy, 2nd edition, Saunders Golden Sunburst Series. New York, 1996. [24] C Huang; CP Huang. Water Res., 1996, 30, 1985-1990. [25] RM Marathe; US Annapure; RS Singhal; PR Kulkarni. Food Hydrocolloid., 2002, 16, 423- 426. [26] AB Parez-Marin; V Meseguer Zapata; JF Ortuno; M Aguilar; J Sases; M Llorens. J. Hazard. Mater. 2007, 139, 122-131. [27] ECN Lopes; FCN Dos Anjos; EFS Vieria; AR Cestari. J. Colloid Interf. Sci. 2003, 263, 542-547. [28] AB Jusoh; WH Cheng; WM Low; A Nora’aini; MJ Megat Mohd Noor. Desalination, 2005, 182, 347-353. [29] F Veglio; F Beolchini; A Gasbarro. Process Biochem., 1997, 32, 99-105. [30] A Zakaria; Mohamed. Water Res., 2001, 32, 4405-4409. 20