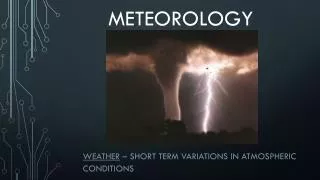
METEOROLOGY
METEOROLOGY. GEL-1370. Chapter Six. Air Pressure and Wind. Goal for this Chapter. We are going to learn answers to the following questions: How and Why Atmospheric Pressure Varies? What forces influence atmospheric motions at aloft and surface?

METEOROLOGY
E N D
Presentation Transcript
METEOROLOGY GEL-1370
Chapter Six Air Pressure and Wind
Goal for this Chapter We are going to learn answers to the following questions: • How and Why Atmospheric Pressure Varies? • What forces influence atmospheric motions at aloft and surface? • How the Wind should flow in a particular region? • What is pressure gradient? • What is Coriolis Force? • What is Geostrophic and Gradient Wind? • Why in Northern Hemisphere winds flow clockwise around regions of high pressure? • Various methods & instruments to measure wind speed and direction?
Atmospheric Pressure • Air pressure: Measure of mass of air above a given level • Atmospheric Pressure decreases with altitude, as there are fewer molecules above us • Temperature, pressure and density of air are related to each other • For a given volume of air, adding more to the column will increase the surface air pressure (temp constant) & if we remove air from the column, the pressure will decrease • If we have two identical column, one undergoes cooling and other warming, the one that cools becomes more dense; one that warms, becomes less dense
Air density remains constant with height; when more air is stuffed (at same temp), in to the column, pressure increases;
Shorter column of cold air & taller column of warm air exert same pressure – aloft cold air is associated with low pressure
Atmospheric Pressure – contd. • IT TAKES A SHORTER COLUMN OF COLD, MORE DENSE AIR TO EXERT THE SAME SURFACE PRESSURE AS A TALLER COLUMN OF WARM, LESS DENSE AIR • Atmospheric pressure decreases more rapidly with elevation in the cold column of air; in the warmer, less denser air (associated with high atm pressure), this pressure does not decrease as rapidly with height, as there are fewer molecules • Horizontal difference in temperature creates a horizontal difference in pressure – pressure gradient; pressure difference creates Pressure Gradient Force that causes air to move from high to low pressure
Atmospheric pressure and measurement • Heating/Cooling of air leads to horizontal variations in pressure that cause the air to move; net accumulation of air above the surface causes the surface air pressure to rise, whereas a decrease in the amount of air --- pressure to fall • Measuring Air Pressure • Air Pressure = Force exerted by the air molecules/area • Barometers: Instruments that detect & measure pressure changes • Units: Bar --- millibars (mb) --- Hectopascal (hPa) • 1013.25 mb = 1013.25 hPa = 29.92 in. Hg
Tinkering with Gas Law • Relationship between temperature, pressure, and density is: Pressure = constant X temperature X density • For constant temperature, P a density • For nearly the same temperature and elevation, air above a region of surface high pressure is more dense than air above a region of low pressure For constant pressure, T a 1/density • For a given atmospheric pressure, air that is cold is more dense than air that is warm
Hg barometer – height of Hg is a measure of atmospheric pressure
Barometers • Aneroid barometer: No fluid; an aneroid cell (small, flexible metal piece), air is partially removed --- small changes in external air pressure cause the cell to expand or contract; size of the cell is calibrated to measure pressure
Barometer – contd. • Higher the reading --- more likely clear weather; lower the reading --- inclement weather • Surface high pressure areas are associated with sinking air and normally fair weather; surface low-pressure areas are associated with rising air and usually cloudy, wet weather • A steady rise in atmospheric pressure usually indicates clearing weather or fair weather; steady drop in atmospheric pressure often signals the approach of a storm with inclement weather • Altimeter (calibrated to indicate altitude) and barograph (recording aneroid barometer) are two types of aneroid barometers
Pressure Readings • Problems associated with reading Hg column (in obtaining air pressure) are: • Temperature (expands when heated & contracts when cooled); Corrections are made as if they were read at the same temp. • Changes in Gravity: Earth mass distribution leads to differences; must be corrected • Instrument Error: Mainly due to the surface tension of Hg against the glass tube The corrected pressure is called ‘Station Pressure’ • Pressure changes vertically; Monitoring changes in horizontal pressures that we normalize with respect to altitude (sea level pressure) • Atmos. pressure decreases ~10 mb/100 m (0.1mb/m)
Cities A,B,C,D at 4 elevations with different station pressures; b) sea level pressures of 4 cities on a sea level chart; c) isobars drawn on the chart at 4 mb intervals
Surface Map • Isobars do not pass through each point, but with the values interpolated from the data given on the chart • With isobars plotted, the chart is called ‘sea level pressure chart’ or simply ‘Surface Map’ • When weather data are plotted are in this map, it becomes ‘Surface Weather Map’ Surface and Upper-Air Charts: H’s:Centers of high pressure (also called anticyclones) L’s: Centers of low pressure (also known as depressions or mid-latitude depressions or extra-tropical cyclones) – they form in the middle latitudes, outside of the tropics
Surface Map showing areas of high & low pressure; solid lines are isobars at 4 mb intervals; arrows wind direction; winds blow across the isobars
Surface & Upper-Air charts contd. • The upper-air map is a constant pressure chart --- constructed to show height variations along a constant pressure (isobaric surface) – Isobaric maps • Contour lines connect points of equal elevation above sea level • Contour lines of low height represent regions of lower pressure & lines of high height represent region of higher pressure; • Contour lines decrease from south to north; isotherms (dotted line) shows north is colder than south --- cold air aloft is associated with low pressure • Contour lines bend $ turn indicating elongated highs (ridges, warmer air) & depressions (troughs, colder air)
Upper-level 500 mb map for the same day; solid lines: contour lines in meters above sea level; dashed lines:isotherms (°C); wind directions are parallel to the contour lines
Upper-air charts contd. • The winds on the 500-mb chart tend to flow parallel to the contour lines on a wavy west-to-east direction • Surface maps describe where the centers of high & low pressures are found and winds and weather associated with these systems • Upper-air charts are important for weather forecast; upper-level winds determine the movement of surface air pressure systems, as well as whether these surface systems will intensify or weaken
Less dense air in the south; cold air in the north; Height of the pressure surface varies; Changes in elevation of a constant pressure surface shown as a contour lines on a isobaric map
Forces that influences the wind • Newton’s Laws of Motion: • First Law: An object will continue to rest or its uniform motion unless it is compelled by an external force • Second Law: F = ma (Acceleration of an object is caused by all the forces acting on it); Force acting on it is proportional to acceleration (Acceleration is the speeding-up, the slowing down) Forces that affect the horizontal movement of air are: • Pressure Gradient Force • Coriolis Force • Centripetal Force • Frictional Force
Pressure at the bottom of each tank is a weight of water above; pressure at the bottom of A > pressure at the bottom of B; greater the difference higher the force
Pressure Gradient Force • Pressure Gradient = Pressure Difference/distance • Pressure Gradient Force is the force that causes the wind to blow; closely spaced isobars on a weather chart indicate steep pressure gradients, strong forces, and high winds • Pressure gradient force (PGF) is directed from higher toward lower pressure at right angles to the isobars • Magnitude of this force is directly related to the pressure gradient
PGF between 1 & 2 is 4 mb/100km; PGA: Net force directed from higher toward lower pressure
Closer isobars--- greater pressure gradient--- stronger PGF--- greater the wind speed– length of arrows indicate magnitude of PGF
Surface Weather Map • Dark Grey lines: Isobars in mb • A deep low with a central pressure of 972 mb • Distance along X-X’ is 500 km • Difference in pressure between X & X’ is 32 mb • Pressure gradient = 0.064 mb/km • Tightly packed isobars along the green line associated with northwesterly winds of 40 knots • Wind speeds are indicated by barbs and flags; would be a wind from the northwest at 10 knots • Solid blue line is a cold front; solid red line is a warm front; heavy dashed line is a trough
Coriolis Force • It is fictitious force resulting from the rotation of the earth • To an observer on the earth, objects moving in any direction (north, south, west, east) are deflected to the right of their intended path in the Northern hemisphere and to the left of their intended path in the Southern Hemisphere. • The amount of deflection depends upon • Rotation of the earth • Latitude (0 at equator and maximum at the poles) • Objects’s speed
If we watch from above, the ball moves on a straight path; for anyone in platform B, the ball appears to deflect to the right of its intended path
All freely moving objects (ocean currents, aircraft, artillery projectiles, air molecules) seem to deflect from a straight-line path; it is greater at the poles and 0 at the equator
Geostrophic (Earth turning) Wind • Why winds aloft more or less parallel to the isobars or contour lines? • Consider air at 1-km above the earth’s surface; the PGE acts on the air accelerating it northward toward lower pressure--- when the air begins to move, CF deflects the air toward its right, curving its path ---as the speed of air increases (2,3,4) CF increases bending the wind more; CF increases with latitude; at point 5, net force = 0--- wind flows in a straight path, parallel to the isobars at a constant speed – This flow of air is called Geostrophic Wind • Coriolis acceleration = 2 w x v = 2 wv cos q (q: latitude; w: angular velocity of rotation of earth; v: vertical velocity of air mass)
At 1-km above earth’s surface, the isobaric lines are evenly spaced (constant PGF); parcel of air left at 1; two forces act-PGF and CF; CF increases with lati.
Isobars and contours on a upper-level chart; when widely spread, flow is weak; when narrowly spaced, flow is stronger; increase in winds results in a stronger CF which balances larger PGF
Geostrophic wind contd. • When the flow is purely geostrophic, the isobars (or contour lines) are straight and evenly spaced and wind speed is constant; the speed of geostrophic wind is directly related to the pressure gradient • Curved Winds Around Lows & Highs Aloft: • The counter clockwise flow of air around Lows (known as cyclones) is anticyclonic flow • Clockwise flow of air around a high or anticyclone is called anticyclonic flow • In Figure a) at point 1, PGF accelerates the air inward toward the center of the low and the CF deflects the moving air to its right, until the air is moving parallel to the isobars at position 2
Winds and related forces around areas of low and high pressure above the friction level in the Northern Hemisphere
Curved winds around lows and highs aloft – contd. • If the wind were geostrophic, at position 3 the air would move northward parallel to straight-line isobars at a constant speed • Gradient Wind: Wind that blows at a constant speed parallel to curved isobars above the level of frictional influence • Centripetal acceleration: Force directed towards the center • Winds on Upper-level charts: On the upper-level 500-mb chart, the winds tend to parallel the contour lines; wind is geostrophic where it blows in a straight path parallel to evenly spaced lines; it is gradient where it blows parallel to curved contour lines
Winds on upper-level charts • When the lines are closer together, winds are stronger • Where the lines are farther apart, the winds are weaker • Meridional Flow: When wind blows in a north-south trajectory • Zonal Flow: Winds blowing in a west-to-east direction • Winds aloft in middle and high latitudes generally flow from west to east –shorter Time of Flight from SFO to NY than NY to SFO • Surface Winds: • Winds on a surface weather map do not blow exactly parallel to the isobars; instead, they cross the isobars, moving from higher to lower pressure; the angle at which the wind crosses the isobars varies, but averages about 30°. The reason for this behavior is friction
Upper-level 500-mb showing wind direction; solid gray lines are contours in meters AMSL; dashed red lines are isotherms in degree C
Surface winds – contd. • Friction Layer: The atmospheric layer that is influenced by friction (planetary boundary layer) usually extends upward to an altitude near 1000m above the surface • In Fig a) wind aloft is blowing at a level above the frictional influence of the ground; the wind is ~ geostrophic and blows parallel to the isobars with the PGF on its left is balanced by the CF on its right • Near the surface, friction reduces the wind speed, which in turn reduces the coriolis force; weaker CF no longer balances the PGF and the wind blows across the isobars toward lower pressure
Effect of surface friction is to slow down the wind; near the ground, the wind crosses the isobars & blows toward lower pressure; thisproduces an outflow of air around a high and an inflow around a low
Surface weather map showing isobars and winds in December in South America; b) boxed area shows the idealized flow around surface-pressure systems in the Southern Hemisphere
Surface winds & Vertical air motions • In the Northern hemisphere, surface winds blowing counterclockwise and into a low; they flow clockwise and out of a high • In the Southern hemisphere, winds blow clockwise and inward around surface lows, counterclockwise and outward around surface highs • Vertical Air Motions: As air moves inward toward the center of a low-pressure area, it must go somewhere. Since the converging air cannot go into the ground, it slowly rises and begins to spread apart • The vertical motions ~ several cm/s (1.5 km/day)
Winds and air motions associated with surface highs and lows in the Northern Hemisphere
Vertical motion – contd. • Hydrostatic Equilibrium: When the upward-directed pressure gradient force is exactly balanced by the downward force of gravity, equilibrium exists • Hydrostatic equilibrium does not exist in violent thunderstorms and tornadoes where the air shows vertical acceleration
Measurement of Wind Speeds • Onshore Wind: Wind blowing from the water onto land • Offshore Wind: Wind blowing from land to water • Upslope Wind: Air moving uphill • Downslope Wind: Air moving downhill • Wind Direction: calm is zero; 360° is North • Prevailing Wind: Wind direction most often observed during a given time period; prevailing winds greatly affect the climate of a region • In the Northeastern half of the US, the prevailing wind in winter is northwest & in summer, it is southwest • Wind Rose: Indication of the percentage of time the wind blows from different direction
Unprotected (from wind) trees are sculpted into ‘flag’ trees