Understanding the Atmosphere: Composition, Layers, and Weather Dynamics
This overview of atmospheric science covers the key components and layers of the atmosphere, including the predominant gases: nitrogen (78%), oxygen (21%), and trace gases. It explores the layers of the atmosphere, such as the troposphere where weather occurs, and discusses energy transfer methods like conduction and convection. The role of water vapor, humidity, and cloud formation in weather systems is highlighted, alongside concepts of temperature, pressure, and the factors influencing climate dynamics. Discover the foundational elements that shape our weather and environment.

Understanding the Atmosphere: Composition, Layers, and Weather Dynamics
E N D
Presentation Transcript
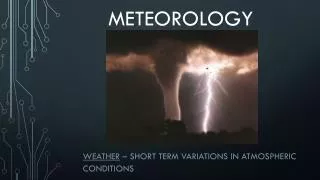
Meteorology The study of the atmosphere.
The Atmosphere Ch. 11 • Composition: • Nitrogen = 78% • Oxygen = 21% • Argon = 0.93% So far…99.93% • Carbon Dioxide = 0.03% Greenhouse gas • Trace Gases = 0.04% • Water Vapor = varies! • Desert = 0% • Tropical Regions = 4% • Greenhouse gas BIG control of temperature
Ozone = trace gas, protects life from ultraviolet light. • Solid Particles – dust and sea salt particles blown into the air by wind & sea spray. Also ice crystals
Layers • Troposphere – bottom layer where we are at, & where most weather happens • Stratosphere – next layer up; where the ozone is found • Mesosphere – Up higher, Super cold temps. • Thermosphere – Top layer • few gas particles • very hot during day, very cold at night • Exosphere – layer of escaping light gases B4 space
Atmosphere & Sun • Radiation – transfer of energy through waves across space. Waves are light waves. • Energy Budget – Incoming solar energy affected by different things. • Reflected off gases = 6% • Reflected off clouds = 25% • Reflected off surface = 4% • Absorbed by gases = 15% • Absorbed by surface = 50%
What affects these? • Season – Winter vs. Summer • Surface – Land vs. Water –water absorbs heat & loses heat much slower than land • Surface Color – Dark absorbs more, Light reflects more • Conduction – Radiation doesn’t heat air directly. Conduction is transfer of energy by contact • Earth’s surface gets hot • Then air touching surface is warmed
Convection – energy transfer to other regions of a fluid. • Hot air rises up off surface • Cold air drops down to fill in • Cold air is then heat and rises too • Becomes cycle, weather develops from this • Lapse Rate—The rate of temperature drop as you go up in the troposphere.
State of the Atmosphere • Temp. vs. Heat • Temperature—measurement of the energy (speed) of particles • Heat—measurement of the total energy & flow of energy between two different temperatures • Ex. Glass vs. Bathtub • Measuring Temp. • °F, °C, K • 1st 2, ok for everyday use. K used for calculations with gases, no negative #s
Dew Point—temperature where the current water vapor content will reach saturation. • Saturation—maximum amount that can be contained • Higher temps = hold more water vapor • Condensation—change from vapor to liquid • Humidity—measure of the amount of water vapor in the air. • Relative Humidity—compares the amount of water vapor to how much the air could hold. Usually a %
Lifted condensation level—as you go up the temp goes ↓, eventually you will reach 100% rel. humidity at dew point. Water will condense. • Pressure & Density • Highest press. & density bottom of troposphere • Less press. & density as you move up • Temperature & Density—As temp ↑, density ↓
Temperature Inversion-Increase in temperature as you go up. Traps the air. • Wind—Differences in pressure cause the air to move from high to low. • Along surface friction slows the winds • Higher up, winds are faster
Cloud Formation • At dew point, water can condense • Condensation nuclei—particles that water sticks to when condensing; Millions of these = dense water droplets = cloud • Orographic lifting—wind pushes into mountains & rises. Going up, reaches the LCL. • Stability—air mass ability to resist lifting. Depends on the surface under the air (conduction)
Latent Heat—Stored energy in water vapor. Condensation releases this heat. Water + Energy = Water Vapor (Vaporization) Water Vapor = Water + Energy (Condensation) This heat can further strengthen storms!
Types of Clouds • Latin names based on properties • Height • Cirro – High clouds; bases above 6,000 m • Alto – Middle clouds; bases between 2,000 & 6,000 m • Strato – Low clouds; below 2,000 m • Shape • Cirrus – “Hair” wispy stringy cloud • Cumulus – “Pile/Heap” puffy, lumpy clouds • Stratus – “Layer” plain sheets of clouds • Nimbus – “Cloud” Low, gray rain clouds
Cloud Features • Low Clouds—formed by lift from heat by conduction with the surface. Air rises to LCL and droplets can become a cloud. • Cumulus cloud—wind can stretch these into stratocumulus clouds • Stratus cloud—if air is stable only a flat sheet forms. If enough moisture will become a nimbostratus cloud
Middle Clouds—can be all liquid H2O or a mix of liquid and ice. • Altostratus • Altocumulus • High Clouds—all ice • Cirrus • Cirrostratus • Cirrocumulus
Vertical Development—a cumulus cloud with increased moisture will continue to develop because of latent heat. If the air remains unstable, the cloud will continue to grow & develop higher in the atmosphere. A cumulonimbus cloud will become huge and wind will stretch the top of the cloud giving the thunderstorm cloud the “anvil” shape.
The Water Cycle The movement of water in the environment from the surface, ground, and atmosphere. Evaporation Condensation Precipitation Runoff/Gravity
Ch. 12 Weather Dynamics • Weather—current state of the atmosphere. • Climate—Average yearly weather conditions. • Energy balance—More heat in tropics. Air & water move heat toward poles. Distributes heat & keeps a balance • Air Masses—large body of air that takes the characteristics of the area over which it forms.
Air Mass types • Arctic (A) Extremely cold, dry air • Continental Polar (cP) Cool, dry air • Continental Tropical (cT) Warm, dry air • Maritime Polar (mP) Cold, humid air • Maritime Tropical (mT) Hot, humid air • Maritime Atlantic—East coast—Polar is cool air • Maritime Pacific—West coast—Polar is warm air • Both have similar Tropical properties
Air Mass Modification • Air masses move • Encounter new conditions • Changes occur so they are now different than their formation. • Heat—temperature can change with energy transfer • Moisture—evaporation and precipitation
Weather Systems • Global Winds • Coriolis Effect—twist in winds due to Earth’s rotation Coriolis Effect VideoCoriolis Effect Video 2 • Convection Cells • Trade Winds—Equator to 30° Latitude (Hadley Cell) • Prevailing Westerlies—30° to 60° Latitude (Ferrel Cell) • Polar Easterlies—60° to 90° Latitude (Polar Cell) • Jet Streams—Fast currents of air high in the atmosphere. They form at the boundaries of the cells. Jet streams “steer” large weather systems.
Fronts • Front is a boundary region between two air masses with different properties like density • Cold Front—Cold air mass is moving into a warmer air mass. Symbol is blue line with blue that point in the direction of movement. • In summer, will push warm air up over it causing condensation and probably precip. & storms. • Warm Front—Warm air is moving over a cold air mass. Symbol is red line with red that point in the direction of movement. • In winter, bring in moisture causing precipitation.
Stationary Front—Air masses stuck! Usually the 2 air masses have modified & are very similar. Symbol is a combination of warm & cold front symbols. No major storms, & tend to be more similar to warm fronts. • Occluded Front—Cold air mass squeezes a warm air mass into another cold air mass. Warm air is forced up (condense & precip.!). Symbol is a purple line with alternating &
Pressure Systems—Air masses have own press. based on temp. & density. • High Pressure—Cool, dense air. Air moves to low press. • In N. Hemisphere, Coriolis effect causes H press. to spin clockwise. • Give nice weather • Low Pressure—Warm, rising (unstable) air. Air moves in from high press. • In N. Hemisphere, Coriolis effect causes L press. to spin counter-clockwise • Because unstable, give stormy weather
Collecting Weather Data • Surface • Temperature—Thermometer • Pressure—Barometer • Wind—Anemometer • Humidity—Hygrometer • Cloud Height—Ceilometer • Rain—Rain Gauge
High Altitude Data • Weather often due to changes up high. • Weather Balloons • Instrument package carried • The group of instruments is called a radiosonde. • Give valuable info., but are very expensive • Radar • Radio waves bouncing off large particles = only where they are • Doppler radar –changes in radio waves & math = how fast it is moving
Satellites • View more from space • Specialize to get specific data • Infrared—measures heat in clouds = storm strengths • Moisture content of clouds • Expensive, but can last for many years
Analyzing Weather & Forecasts • Station Model—method to show data for a location • Lots of data in small space • Symbols common to all • Surface Analysis • Isopleths—lines connecting equal values of a measured quantity. • Isobars – lines of equal pressure • Isotherms – lines of equal temps.
Forecasts • Short term—based on conditions now & how they will likely change in near future. • Digital—Using collected data and formulas for how air behaves to calculate future conditions. • Analog—Using data and comparing to similar data collected in the past • Long term—using data to determine how the atmosphere will look in the far off future. • How far? Depends on what is known. • Accuracy drops off fast the farther you try to forecast!!!