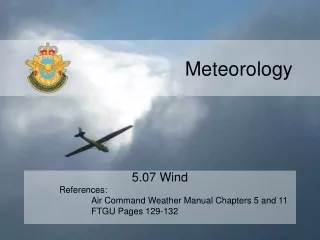
Meteorology
Meteorology. Start. Why do we have such a wide variety of weather here in the Great Plains?. Menu. Menu. Precipitation. Menu. Atmosphere. Station Models. Heat & Temperature. Tornadoes. Greenhouse Effect. Satellites. Air Pressure . Radar. Wind. Hurricanes. Air Masses & Fronts.

Meteorology
E N D
Presentation Transcript
Meteorology Start
Why do we have such a wide variety of weather here in the Great Plains? Menu
Precipitation Menu Atmosphere Station Models Heat & Temperature Tornadoes Greenhouse Effect Satellites Air Pressure Radar Wind Hurricanes Air Masses & Fronts Storm Tracks Water on Earth Weather Instruments Clouds Menu El Nino
To get Zulu Time Menu
Atmosphere Menu
Atmospheric Cycles • Water Cycle • Carbon Cycle • Nitrogen Cycle Menu
Exosphere AtmosphericLayers Thermosphere Ionosphere Mesosphere Stratosphere Menu Troposphere
Troposphere • “Where the air turns over” • Up and down air movements & H2O vapor • Densest air (at bottom) • 75% of entire atmosphere • “Weather sphere” • From surface up to 8 - 16 km • Average temperature and pressure decrease with altitude Menu
Stratosphere • Air flow - horizontal • Little water vapor • Planes fly here • Up to 50 km above surface • Ozone layer at top of stratosphere • Ozone - absorbs and scatters the Sun’s harmful UV rays Menu
Mesosphere • “Middle” layer • Temperature decreases with altitude • Coolest temperatures in atmosphere - at top of Mesosphere • Up to 80 km avove surface Menu
Thermosphere • Up to 1000 km above surface • Atmosphere very thin • Warmest layer (over 1000 degrees C) Menu
Ionosphere • From top of Mesosphere into Thermosphere • Sun’s energy strips electrons from atoms to make many ions • Ion - electrically charged particles • Radio waves bounced off this layer back to Earth • Aurora borealis & Aurora australis Menu
Exosphere Atmosphere Quiz • Outer layer of atmosphere • Outer limits not exactly known Menu
Heat Quiz Heat & Temperature Menu
Heat in the Atmosphere • Heat • thermal energy • energy in moving molecules • moves from warm things to cooler things • more energy = more/faster movement Menu
Temperature • Indicates how fast the molecules of an object are moving • Molecules in hot objects move more quickly than in cold • Average kinetic (moving) energy Menu
Temperature in Thermosphere • Temperature is not the same as heat • You would not feel the high temperature in the Thermosphere • Quick moving = high temperature, but • Few molecules = low heat (low energy) Menu
Measuring Heat • Calorie • measures energy • amount of heat needed to raise the temperature of 1 gram of water 1 degree Celcius • Dietary Calorie = 1000 times larger than a small calorie Menu
Measuring Temperature • 3 Scales • Fahrenheit ( 32 degrees & 212 degrees ) • Celcius ( 0 degrees & 100 degrees ) • Kelvin • Absolute Zero - the temperature at which all molecule vibrations stop • Thermometer • mercury • alcohol Menu
Temperature Scales Temp. conversion Quiz • C = 5/9 ( F - 32) • F = 9/5 C + 32 • C = K - 273 Temp. conversion Wks. Menu
The three different temperature scales have been placed side-by-side in the chart below for comparison. Menu
Heat Transfer • Conduction • movement from one molecule to another • metals = good conductors • gases = poor conductors • not much conduction in “just” atmosphere • transfers heat between air and ground Menu
Heat Transfer • Convection • heated air spreads out = less dense • heated air rises, cooler air sinks • cycle - circular flow of air heats room/atmosphere Menu
Heat Transfer • Radiation • can travel in empty space • travels in straight lines • warms side facing source (ex. Infrared radiation - fireplace) Menu
Energy from Sun • Sun • Ball of hot gas (surface temp. = 5500 degrees C) • Gives off energy - electromagnetic spectrum • Gamma rays • X-rays • Ultraviolet rays • Visible light - sunlight • Infrared rays • Radio waves Menu
Energy from Sun • As energy approaches Earth: • 1/5 (20%) absorbed by atmosphere (ozone) • 1/3 (30%) reflected back into space (clouds, snow, and atmosphere) • Some visible light scattered by gas/dust particles = blue color of sky • 1/2 (50%) heats land and water (absorption) Menu
Isotherm Menu
Isotherm Menu
Isotherm Menu
Isotherm Menu
Greenhouse Effect Lab Greenhouse Effect Lab – Data Sheet Greenhouse Effect Menu
Greenhouse Effect • Infrared rays (heat) reflected from Earth are absorbed by CO2 and H2O vapor in atmosphere • Heat “trapped” near Earth’s surface • “Earth’s blanket” Menu