Download
1 / 19
190 likes | 411 Vues
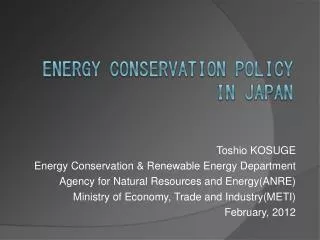
Toshio KOSUGE Energy Conservation & Renewable Energy Department Agency for Natural Resources and Energy(ANRE) Ministry of Economy, Trade and Industry(METI) February, 2012. Current global conditions surrounding energy and energy supply structure of Japan.

E N D
Toshio KOSUGE Energy Conservation & Renewable Energy Department Agency for Natural Resources and Energy(ANRE) Ministry of Economy, Trade and Industry(METI) February, 2012
Current global conditions surrounding energy and energy supply structure of Japan • Principally in Asia, but the energy demands of the world are expected to rise rapidly to about 1.3 times the current amounts by 2030. The energy supply structure will be hard pressed, due to the intensification of the competition to acquire resources among the countries of consumption, such as China. • Japan has the lowest self sufficiency rate among the major industrialized nations. Outlook of global energy International comparison of energy self sufficiency rates (FY2009) (Petroleum equivalent in million tons) Overall Approx. 1.3 times Others Africa Middle East Central and South America India China Asia (excluding Japan, China, India and Korea) Russia Eastern Europe and Central Asia Japan USA OECD (excluding Japan and USA) * The self sufficiency rate is for instances where atomic power is imported. (Figures inside brackets are for instances where atomic power is considered to be produced domestically.) (85%) India Approx. 1.9 times (53%) China USA UK France Germany Japan Italy (70%) (44%) (35%) China Approx. 1.7 times (19%) 2008 12,271 2030 16,014 Source: Calculated from statistics published by IEA. Source: World Energy Outlook 2010. 2
Japan = 1 7.5 6.0 5.7 5.1 2.8 2.1 1.3 (Source) “ Calculated according to IEA Energy Balances of OECD/Non-OECD Countries(2009edition) “ Energy Efficiency in Japan Primary energy supply per GDP unit of each country (2007)
Energy Consumption Efficiency of Each Sector Comparison of energy indices necessary for making 1ton of cement intermediate product (clinker) (FY2003) Comparison of energy indices necessary for making 1kWh electricity by thermal power generation (FY2004) Comparison of energy indices necessary for refining copper 150 200 178 250 145 177 137 202 152 114 145 200 131 130 120 154 150 111 143 133 150 100 100 100 100 100 100 80 50 50 Latin America West Europe North America Latin America Japan Germany US France China China US Russia Japan Japan Europe Asia Korea (Source: ECOFYS (Netherlands)) (Source: Battelle Research Center) (Source: Japan Mining Association) Comparison of energy indices necessary for making 1ton of iron (FY2003) Comparison of energy indices necessary for making 1kl of petroleum product (FY2002) Comparison of energy indices necessary for the rolling process of aluminum board 125 120 130 113 140 120 120 127 110 120 102 101 110 100 120 105 100 110 100 100 100 90 100 80 80 West Europe US and Canada 80 Asian industrial countries Japan Russia Japan EU China US Korea World Japan (Source: Japan Iron Steel Federation) (Source: Solomon Associates) (Source: International Aluminum Association, etc.) Comparison of energy indices necessary for making 1ton of paper and paper board (FY2003) Comparison of energy indices necessary for making 1ton of electrolytic caustic soda (FY2003) 160 144 140 134 119 123 140 115 Source: Nippon-Keidanren International Cooperation Center Excerpt from Outline of Follow-up Result, 2007 (dated November 14, 2007) (http://www.meti.go.jp/committee/materials/downloadfiles/g70216a04j.pdf) 110 120 120 104 100 100 100 100 100 80 60 80 East Europe West Europe Japan Sweden Canada US Japan Korea China US (Source: ANRE, Statistics Annual Report (UK), Environmental Report (Canada), etc.) (Source: Chemical Economic Handbook, etc.)
1. Regulation Energy Efficiency Law : Enacted 1979 2. Promotion - Tax incentive - Subsidies (including for R&D) - Preferential interest rate, etc. 3. Voluntary Action Japan’s Energy Efficiency Policy
Overview of Japan’s energy efficiency policy Industrial sector Commercial/residential sector Transportation sector Commercial residential Energy Conservation Law Energy management obligation by Energy Conservation Law (by an unit of a company ) Energy management obligation by Energy Conservation Law (Carrier, Consignor) Regulation Enhancement of energy efficiency of buildings and residences by Energy Conservation Law Top Runner Program Energy-saving labeling Budget and Tax Housing Eco-points System Promotion of high fuel economy vehicles(clean energy vehicles) Subsidies for promoting energy efficient facilities (high-efficient building , high-performance industrial furnace etc.) Promotion Tax incentive for energy efficient reform of residence, Tax incentive / Low-interest loan Subsidies for promoting energy efficiency technological development Voluntary Voluntary action 6
<Regulations> in each factories/offices - Energy Management System - Energy Managers saving-energy experts assigned mandatory - Reporting of Energy Consumption to the Gov. * Chain-Stores included → expansion of coverage Japan’s Energy Efficiency Policy ① Factories/Offices *
Encouraging Energy Management System Energy managers must be assigned in every factory/ office with a certain quantity of energy consumption. Encouraging their management by awarding best practices
<Regulations> - Carriers, Consigners - Setting higher fuel efficiency standard <Voluntary Action> - “Eco Drive”, “Idling Stop” method of driving ② Transportation
<Regulations> - Constructors, Retailers ③ Houses/Buildings
<Regulations> - “Top Runner” Program ④ Automobiles/Electronics
Top Runner Program < Products> < Improvement of energy efficiency> Passenger vehicles 22.5 %(FY1995→FY2005) Air-conditioners 67.8%(FY1997→FY2004) Electric refrigerators 55.2%(FY1998→FY2004) TV sets 25.7%(FY1997→FY2003)
Present Energy situation after the Great Earthquake of Japan
Unit 6 Unit 5 Unit 1 Unit 2 Unit 3 Unit 4 TEPCO Nuclear Power Stations TEPCO Fukushima Dai-ichi Nuclear Power Station Before the Earthquake and Tsunamis After the Earthquake and Tsunamis Air Photo Service Inc (Myoko, Niigata Japan) 14
Impact on Energy Supply/Demand in Japan • Tokyo Electric Power Company supplies electricity to an area with 42 million people and 40% of Japan’s GDP, but lost 40% of its generation capacity after the earthquake and tsunami. 33GW (Apr.15) Peak Demand of the Month in 2010 49GW (Aug.18) 46GW (Jul.15) 42GW (Jun.28) Peak Demand of the Month in 2011 Supply Capacity of TEPCO in 2011 15
Supply–Demand Measures for last Summer • Major measures taken regarding demand to secure the supply-demand balance during this summer are as follows: Large-volume-electricity customers (enterprises with contract for supply of 500kW or more) Approaches across several fields (1) Voluntary formulation and implementation of plans for suppressing the power consumption in the peak time zone (2) Application of Article 27 of the Electricity Business Act (Restriction on Use of Electricity) • Development of electricity-saving campaign (2) Thorough visualization of electricity supply–demand data (“Denki Yoho (Electricity Forecast)”) (3) “Tight supply-demand balance alert” to notify the tight supply-demand balance Small-volume-electricity customers (enterprises with contract for supply below 500 kW) • Presentation of examples of electricity-saving measures (2) Encouragement of formulation and announcement of voluntary electricity-saving action plans (3) Electricity-saving supporters’ visits Households • Urgent electricity-saving request was made when there was a concern for rolling blackout implementation (2) Information provision via TV, radio, mobile phones, and disaster-prevention public address system (1) Presentation of examples of electricity-saving measures (2) Request for electricity saving through media (3) Distribution of “Electricity-saving education” materials to elementary and junior high schools 16
Supply Measures last Summer The decrease of electricity supply capacity of TEPCO and Tohoku EPCO due to the effects of earthquake and tsunami ・・▲26 million kW The decrease of supply capacity ▲26 million kW • The measures taken regarding supply for ensuring a supply-demand balance this summer were mainly as follows:*Service Areas of Tokyo Electric Power Co.(TEPCO) and Tohoku EPCO Power Co. 5.5 million kW - = 17
Measures for Balancing Supply and Demand for this Winter January (10,000 kW) Hokkaido Tohoku Tokyo Chubu Kansai Hokuriku Chugoku Shikoku Kyushu -80 (-1.1%) -33 (-0.4%) -113 (-0.7%) Maximum electricity demand 579 1,420 5,150 2,342 2,665 528 1,074 520 1,533 7,069 8,629 15,698 1. This winter, we would like to request electricity saving to keep an appropriate supply–demand balance and avoid restriction of electricity use or implementation of rolling blackouts. On the basis of the summary of this summer, we would like to make a request for electricity saving within the scope where enterprises can minimize the impact on production and operation. 2. We are still examining the supply-demand balance for this winter, but it is estimated that the balance will be tight in the Kansai and Kyushu Electric Power Company areas with a high ratio of nuclear power generation. 3. “Electricity Supply-Demand Measures for this winter” is released on 1st of November ,2011. (Reference 1) Forecast of Supply and Demand This Winter Estimated at the Energy and Environment Conference on July 29 (Reference 2) Nuclear Power Generation Ratio of the Electricity Utilities (based on FY 2009 power generation) 18