Population limitation: history & background
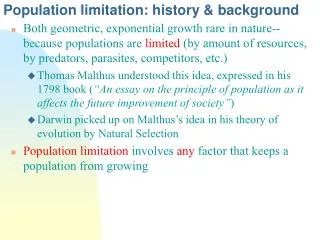
Population limitation: history & background. Both geometric, exponential growth rare in nature--because populations are limited (by amount of resources, by predators, parasites, competitors, etc.)

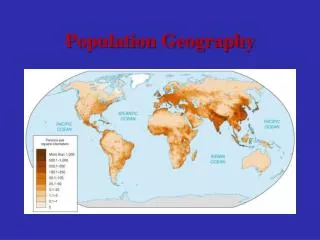
Population limitation: history & background
E N D
Presentation Transcript
Population limitation: history & background • Both geometric, exponential growth rare in nature--because populations are limited (by amount of resources, by predators, parasites, competitors, etc.) • Thomas Malthus understood this idea, expressed in his 1798 book (“An essay on the principle of population as it affects the future improvement of society”) • Darwin picked up on Malthus’s idea in his theory of evolution by Natural Selection • Population limitation involves any factor that keeps a population from growing
Density-independent limiting factors are not proportional to population size (e.g., catastrophic weather events) • Density-dependent limitation is proportional to population size, and has a special name: population regulation
Population regulation • Implicit in the concept of regulation is intraspecific competition • decreased per capita growth, reproduction, and/or survival within a population or species due to interactions among individuals over limited resources • Strength of intraspecific competition proportional to population size
Modeling population regulation • Assumptions of logistic model • Relationship between density and rate of increase is linear • Effect of density on rate of increase is instantaneous (we’ll relax this assumption later) • Environment is constant (i.e., r is constant, as is K = carrying capacity) • All individuals are identical (i.e., no sexes, ages, etc.) • No immigration, emigration, predation, parasitism, interspecific competition, etc. • Purpose of such a heuristic, deterministic model is to include just the essential idea of regulation, and nothing else
Logistic model of population regulation • First, an “intuitive” mathematical derivation of logistic population model • Also known as sigmoid population growth model • Developed by Pearl and Reed, based on work of Verhulst & others (early 1900’s) • Let dN/dt = r(N)N • This is just the exponential model, except that r is now a function of N (= population size) • Specifically, r declines with population size • Define r(N) as r*(1-(N/K)); notice that this function r(N) goes from r as N-->0, to 0 as N-->K; • K defined as population carrying capacity. • Model in full: dN/dt = r*N*(1-(N/K)) = r*N*(K-N)/K
r(N) r K Population size (N) Graphic of logistic model per capita growth rate {(dN/dt)*(1/N)} Exponential model r r {(dN/dt)*(1/N)} Population size (N)
How does logistic model behave? • Here’s the model again: dN/dt = r*N*(K-N)/K • When N approaches K, right-hand expression ((K-N)/K) approaches 0. Thus, dN/dt approaches 0, which means that N does not change with time: Population is stable! • Alternatively, when N approaches 0, right-hand expression ((K-N)/K) approaches 1. Thus dN/dt approaches r*N*1, i.e., dN/dt is approximately equal to r*N: Population grows exponentially! • Graph of N versus time (t) is sigmoidal in shape, starting out like exponential growth, but approaching a line with slope of zero.
Logistic population growth in Lynx; recall that r = b - d! • Solution to logistic model (involves solving a differential equation, using methods of differential calculus): • N(t) = K/(1 + b*e-rt), where b = [K-N(0)]/N(0) • This equation can be used to plot N vs. t
More about behavior of logistic population model: • How does the slope of the logistic curve (N as a function of t) vary with N? This can be seen intuitively--goes from 0 (at low N) to maximum (at intermediate N), back to 0 at N = K (i.e., hump-shaped curve, with maximum at N = K/2).
Per capita rate Per capita rate Per capita rate N N N What exactly does “regulation” mean? • Regulation means the tendency for a population to remain dynamically stable, no matter where it starts (assuming it is non-zero) • Thus N approaches K, the carrying capacity, from both N < K, and N > K • K is thus an “equilibrium point” of the model, because of negative feedback on r as N gets larger • We can show this idea of dynamic equilibrium graphically: deaths deaths deaths births births births K K K
How do ecologists test for population regulation, density-dependence? • Laboratory: Study population growth in controlled, simple environment with limited resources • Look for evidence for carrying capacity (population stays at, or returns to fixed abundance) • Field: look for evidence of density-dependence of demographic variables Let’s look at some evidence of these three types...
Sheep population on island of Tasmania leveled off after initial exponential growth
Ringed necked pheasants on Protection Island again: Population growth rate declines away from exponential, approaching constant population because of limited resources!(from G.E. Hutchinson, 1978, An Introduction to Population Ecology, Yale University Press.)
Density-dependent survival probability in Daphnia pulex, lab cultures
Density-dependent Lambda for populations of Daphnia pulex, lab cultures: Note linear decline in lambda with density!
Regulatory density-dependence in Mandarte Island (British Columbia) song sparrow population (Melospiza melodia): (a) size of “floater” = non-territorial individuals, (b) no. young fledged per female, (c) proportion of juveniles surviving one year
Density-dependence of larval migration and mortality in grain beetle (Rhizopertha dominica)
Density-dependence of plant dry weight in flax (Linum) plants in greenhouse
Returning to real world, how important are density-dependent versus density-dependent (= regulatory) population limitation? • Controversy erupted among ecologists in 1950’s on relative importance of these two kinds of limitation • Andrewartha and Birch challenged primacy, and even necessity of, density-dependence in population limitation • “The distribution and abundance of animals” (1954) • Work based primarily on Thrips imaginis (rose pest) • Their argument: Weather alone is sufficient to control (regulate?) these insect populations
78% of variability in Thrips imaginis population (just prior to peak abundance in December) attributable to weather variables (e.g., rainfall in Sept. & Oct.)
Other ecologists championed primacy of density-dependence in populations • Scientists in this “density-dependence school”: Lotka, Gause, Nicholson, David Lack • Lack’s (1954) book particularly influential: “The natural regulation of animal numbers” • These scientists argued that even in the kinds of insects that Andrewartha and Birch studied, density-dependence is important • Fred Smith (1961) pointed out that even in Andrewartha and Birch’s Thrips imaginis data, population change is density-dependent
Density-dependence inThrips imaginis: Change in population size from November to subsequent October decreases with increasing size of previous October population
Resolution of debate on density-dependence versus density-independence? • Ecologists today recognize that the dichotomized positions of scientists in 1950’s were unnecessarily extreme • Most, if not all, populations are limited at least to some extent by density-dependent factors • Density-independent factors are also usually important (e.g., weather, disease) • Weather does not act just in density-independent way (e.g., proportionately more individuals occupy refuges in smaller population) • Thus DD and DI factors interact in complex ways • We still do not understand regulation in most pops.
Conclusions: • In nature, most populations are limited by resources, predators, etc. • We developed a model for population growth in a limited environment, using linear decrease in r with population size--the logistic population model • Logistic population growth is also known as sigmoid growth, because population approaches an equilibrium size (K) in an s-shaped manner • Lots of examples of limitation, regulation, density-dependence seen in nature • Debate about prominence of density-dependent versus density-independent factors in nature resolved: both are important, but in complex ways
Acknowledgements: Most illustrations for this lecture from R.E. Ricklefs and G.L. Miller. 2000. Ecology, 4th Edition. W.H. Freeman and Company, New York.