Download
1 / 11
110 likes | 181 Vues
Explore caseload data by age group, program setting, child care account, and more. Cost projections and budget allocations included.

E N D
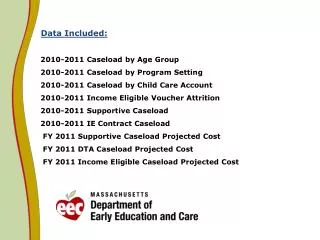
Data Included:2010-2011 Caseload by Age Group2010-2011 Caseload by Program Setting2010-2011 Caseload by Child Care Account2010-2011 Income Eligible Voucher Attrition 2010-2011 Supportive Caseload2010-2011 IE Contract Caseload FY 2011 Supportive Caseload Projected Cost FY 2011 DTA Caseload Projected Cost FY 2011 Income Eligible Caseload Projected Cost
Standard Deviation: Infant: 238; Toddler: 371; Preschool: 574; School Age: 1,466; Total: 2,165 Avg = Average (09/01/09 – 08/01/10)
Standard Deviation: ARRA: 167; DTA: 558; Income Eligible: 1,907; Supportive; 333 Total: 2,177 Avg = Average (09/01/09 – 08/01/10)
FY 2011 Supportive Caseload Projected Cost FY11 Approp: $85M Light blue represents actual amount billed
FY 2011 DTA Caseload Projected Cost FY11 Approp: $127.3M Light blue represents actual amounts billed
FY 2011 Income Eligible Caseload Projected Cost FY11 Approp: $228.5M • Light blue represents actual amount billed