Download
1 / 4
50 likes | 171 Vues
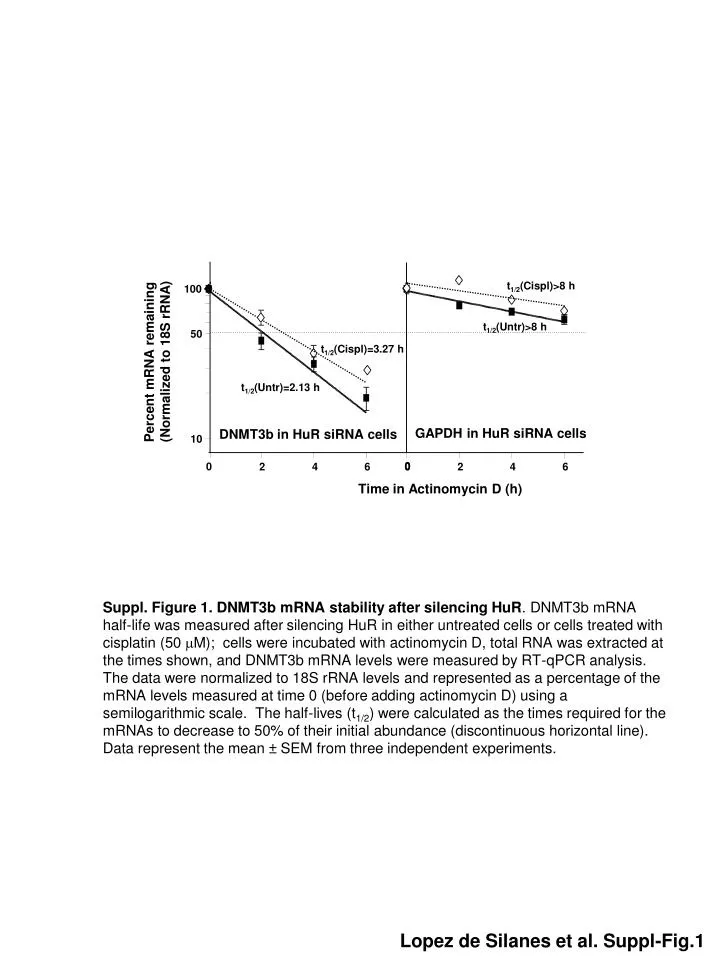
t 1/2 (Cispl)>8 h. 100. t 1/2 (Untr)>8 h. 50. t 1/2 (Cispl)=3.27 h. Percent mRNA remaining (Normalized to 18S rRNA). t 1/2 (Untr)=2.13 h. GAPDH in HuR siRNA cells. DNMT3b in HuR siRNA cells. 10. 0. 0. 2. 4. 6. 0. 2. 4. 6. Time in Actinomycin D (h).

E N D
t1/2(Cispl)>8 h 100 t1/2(Untr)>8 h 50 t1/2(Cispl)=3.27 h Percent mRNA remaining (Normalized to 18S rRNA) t1/2(Untr)=2.13 h GAPDH in HuR siRNA cells DNMT3b in HuR siRNA cells 10 0 0 2 4 6 0 2 4 6 Time in Actinomycin D (h) Suppl. Figure 1. DNMT3b mRNA stability after silencing HuR. DNMT3b mRNA half-life was measured after silencing HuR in either untreated cells or cells treated with cisplatin (50 M); cells were incubated with actinomycin D, total RNA was extracted at the times shown, and DNMT3b mRNA levels were measured by RT-qPCR analysis. The data were normalized to 18S rRNA levels and represented as a percentage of the mRNA levels measured at time 0 (before adding actinomycin D) using a semilogarithmic scale. The half-lives (t1/2) were calculated as the times required for the mRNAs to decrease to 50% of their initial abundance (discontinuous horizontal line). Data represent the mean ± SEM from three independent experiments. Lopez de Silanes et al. Suppl-Fig.1
pMIR-DNMT3b-3’UTR-A pMIR-DNMT3b-3’UTR-B1 pMIR-DNMT3b-3’UTR-B2 pMIR-DNMT3b-3’UTR-full length pMIR-p53-3’UTR pMIR-GAPDH Luciferase A B1 B2 FL p53 GAPDH 120 100 80 Luciferase activity (Fragment/GAPDH) 60 40 20 A B1 B2 FL p53 A B1 B2 FL p53 A B1 B2 FL p53 A B1 B2 FL p53 0 HuR siRNA-Untr HuR siRNA-Cispl Ctrl siRNA-Untr Ctrl siRNA-Cispl Suppl. Figure 2. HuR levels and cisplatin treatment affect the activity of a reporter construct bearing different regions of DNMT3b 3’UTR. Two days after siRNA transfections, the expression vector pMIR-report (firefly luciferase reporter system) containing either full-lenght DNMT3b 3’UTR (FL) or different regions of the DNMT3b 3’UTR (A, B1 or B2) were transiently cotransfected into RKO cells along with pGL4-Renilla (used to normalize for transfection efficiency); 24 hrs later, cells were treated with cisplatin (50 M, 8 hrs), and protein was collected. Protein extracts were used for the detection of firefly and renilla luciferase activities (FL and RL, respectively). Graph shows the relative levels of firefly luciferase activity seen in the various pMIR-DNMT3b transfection groups relative to pMIR-GAPDH after normalization to renilla activity (for transfection efficiency) and to pMIR-GAPDH (not a target of HuR). A vector containing the fragment of the 3’UTR of p53 was used as a positive control here, as well as in the biotin pull-down assays (Fig. 2). Values represent the means and SEM from three independent experiments. Lopez de Silanes et al. Suppl-Fig.2
A Cispl: C 10 15 20 30 (min) p-Chk2 - Chk2 - -tubulin - B 1D 7 10 • TIAR • HuR Untr Cispl • TIAR • HuR Suppl. Figure 3. Cisplatin treatment increases the activity of the HuR kinase Chk2 and affects the HuR distribution in a two-dimensional Western blot analysis. (A) (A) RKO cells were treated with 50 µMCisplatin at the times indicated and whole-cell lysates were collected for immunoblotting analysis of phosphorylated Chk2 and total Chk2. -Tubulin signals show the evenness in sample loading. (B) RKO cells were either left untreated or treated with cisplatin (50 µM) and collected 1 h later. A modest leftward shift in HuR indicates a gain in negative HuR charge, suggestive of phosphorylation (continuous line). TIAR, whose phosphorylation status does not appear to change with cisplatin, served as a control for size and pI distribution (discontinuous lines). The image shown is representative of two independent experiments.11 Lopez de Silanes et al. Suppl-Fig.3
Untreated Cisplatin 8 6 mRNA fold enrichment (RBP-IP/IgG-IP) 4 * 2 * * 0 TIA1 TIAR AUF1 TIA1 TIAR AUF1 Suppl. Figure 4. Cisplatin treatment alters the association of RNA-binding proteins TIA-1, TIAR, and AUF1 with the DNMT3b mRNA. IP using IgG (control) or using antibodies that specifically recognized RNA-binding proteins (TIA-1, TIAR or AUF1) were performed using lysates that were prepared from either untreated RKO cells or from RKO cells treated with for 2 h with cisplatin (50 µM). RNA was isolated for RT-qPCR analysis to detect mRNAs encoding DNMT3b isoform 3 or GAPDH (a housekeeping control transcript for background binding), which was used to normalize the data. Data are shown as the mean SEM from three experiments; * p ≤ 0.05. Lopez de Silanes et al. Suppl-Fig. 4