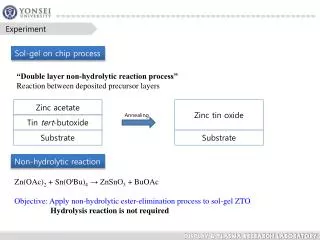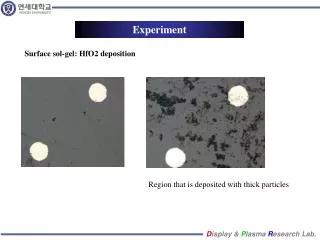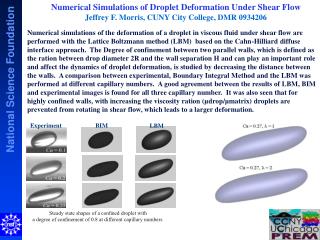
Experiment
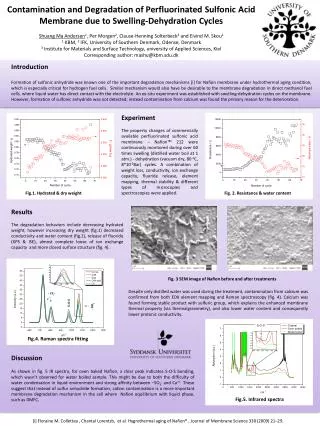
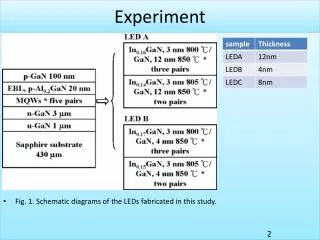
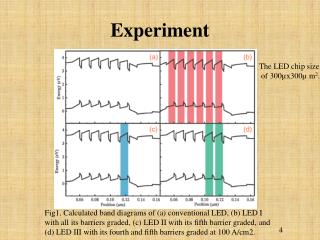
Experiment. The LED chip size of 300µx300µ m 2. Fig1. Calculated band diagrams of (a) conventional LED, (b) LED I with all its barriers graded, (c) LED II with its fifth barrier graded, and (d) LED III with its fourth and fifth barriers graded at 100 A/cm2. 4. Results and Discussion.

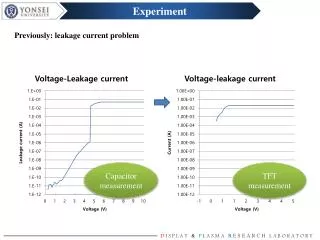
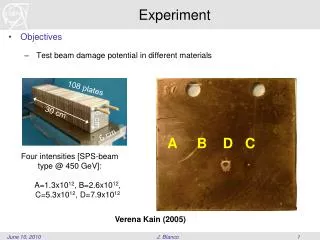
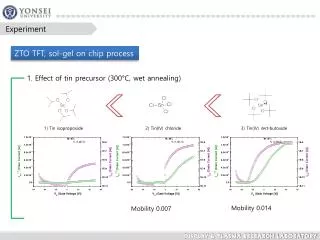
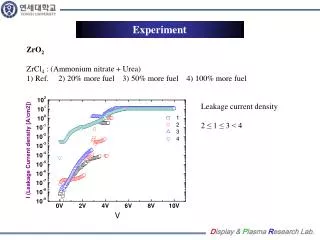
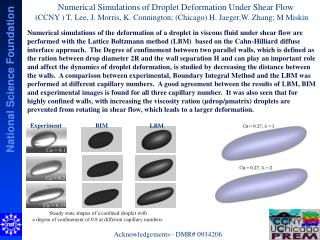
Experiment
E N D
Presentation Transcript
Experiment The LED chip size of 300µx300µ m2. Fig1. Calculated band diagrams of (a) conventional LED, (b) LED I with all its barriers graded, (c) LED II with its fifth barrier graded, and (d) LED III with its fourth and fifth barriers graded at 100 A/cm2. 4
Results and Discussion Fig. 3. (a) Hole concentrations and (b) electron concentrations ofconventional LED, LED I, LED II and LED III at 200 A/cm2. Fig. 2. (a) Hole concentrations and (b) electron concentrations of conventional LED, LED I, LED II and LED III at 40 A/cm2. 5
Results and Discussion Fig. 5. Simulated light output power of conventional LED, LED I, LED II, and LED III. Fig. 4. Radiative recombination distributions of conventional LED,LED I, LED II, and LED III at (a) 40 A/cm2and (b) 200 A/cm2. 6