Download
1 / 84
870 likes | 1.38k Vues
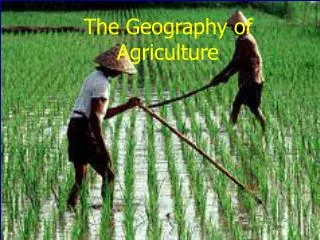
1. What is Geography? - Greek Definition. Geo = “Earth”; graphy = “to write” Geography = to write about the Earth. 2. Purpose of Early Geography. First geographers had practical purposes. They explored uncharted territories, mostly for trade.

E N D
1. What is Geography? - Greek Definition • Geo = “Earth”; graphy = “to write” • Geography = to write about the Earth
2. Purpose of Early Geography • First geographers had practical purposes. They explored uncharted territories, mostly for trade. • First geographers included Chinese, Greeks, North Africans. They were also first cartographers making detailed maps & making measurement systems to describe the world.
3. Eratosthenes • Head librarian at Alexandria during third century, BC • One of world’s first cartographers • Computed Earth’s circumference based on sun’s angle at Summer Solstice and the distance between 2 Egyptian cities: Alexandria & Syene. Only about 109 miles too long! • Coined the term geography
4. Ptolemy • Wrote an 8-volume Guide to Geography--included rough maps of landmasses as he understood them and a global grid system • Contributed to both geography and the technical aspects of cartography
5. Exploration • 1400 AD, knowledge of the globe expands rapidly as explorers travel the EArth mapping landforms, climates, indigenous cultures, and the distribution of plants and animals • Influential early explorers = Bartholomeu Dias, Christopher Columbus, Ferdinand Magellan • Later explorers include Alexander Humboldt & members of the Lewis & Clark expedition
6. George Perkins Marsh • 1864 - Wrote Man and Nature, or Physical Geography as Modified by Human Action • Traveled a lot through Europe and Middle East • Warned that people’s willful destruction of the environment could have disastrous results--he had seen the desertification of the Fertile Crescent
7. Carl Sauer • Early modern geographer (1925), said cultural landscapes (result of human interaction with environment) should be the focus of geographic inquiry • Even landscapes that look natural have had some alterations as a result of human society
8. The Quantitative Revolution • A movement in 1950s and 60s where social scientists stress using empirical measurements, hypothesis testing, computer programs to explain geographic patterns. • Social sciences are influenced by modernist philosophy and tech innovation. • Credited for bringing geography into mainstream science; criticized for limiting questions geographers ask and methods they use to investigate.
9. Remote Sensing • Process of capturing images from Earth’s surface from air using satellites or airplanes • Can be digital or analog photos; data can be collected from several bands of electromagnetic spectrum (e.g. infrared to collect vegetation data) • Gives access to landscapes previously out of reach (e.g. Amazon Rainforest) • Helps measure change in land use
10. Global Positioning System (GPS) • A group of satellites that orbit the Earth, broadcasting location information to handheld receivers on Earth’s surface • With a receiver, you can get highly accurate info about geographic location in terms of latitude and longitude, from any point on Earth
11. Geographical Information System (GIS) • A family of software programs that allow geographers to map, analyze, and model spatial data • Most use thematic layers, made up of individual maps that contain specific features like roads, stream networks, or elevation contours • Multiple layers can be combined in to one map using features to help geographers understand and analyze spatial relationships between different phenomena
12. Divisions of Geography • Geography is typically divided into three areas (each is further divided). • Human geography, physical geography, and Earth system science (blending the first two). • Earth system science is often called human environment relationships (HER), or environmental geography.
13. Human Geography • Broadly defined as the study of human activiites on the Earth’s surface. • Human geographers generally focus their work in more specific subdisciplines including population geography, cultural geography, urban geography, agricultural geography, and political geography. • Often, human geographers combine two or more subfields in their research, hoping to better understand the spatial dimensions of complex, interlinked social systems.
15. Physical Geography • Physical geographers study spatial characteristics of the Earth’s physical and biological systems • Many natural scientists, including meteorologists, climatologists, ecologists, oceanographers, geologists, soil scientists, and hydrologists, study physical geography. • Through understanding of the spatial variability of the phenomena under investigation each of these types of scientists gain insight into why certain phenomena behave the way they do in certain places
16. Earth System Science • Fairly new area of focus for the sciences, became popular in the last few decades. • Arose as a way to study interactions between physical systems on a global scale. • Geographers have been at the forefront of this emerging discipline.
17. Systematic Geography • Study of the Earth’s integrated systems as a whole, instead of focusing on particular processes in a single place. • Allows geographers to apply their knowledge of a specific spatial process broadly beyond unique places to other areas across the globe.
18. Environmental Geography • Results from intersection of human and physical geography. • Environmental geographers come from almost every academic discipline; frequently occupy prominent positions at the forefront of debates regarding anthropogenic, or human-induced, environmental change; conservation planning; and sustainability. • Concerned with anything from history of a given landscape to the effects of pollution on impoverished neighborhoods, to the creation of nature reserves for endangered species.
19. W.D. Pattison’s Four Traditions of Geography • Pattison = University of Chicago geographer who published a defining piece on geography’s 4 defining traditions (1964) • Earth-science tradition = essentially physical geography • culture-environment tradition = HER or environmental geography • locational tradition = analysis of spatial data through cartography • area-analysis tradition = regional geography, an investigation and description of unique pieces of Earth’s surface
20. Five Themes of Geography • Location - position on Earth’s surface (absolute/relative) • Place: Physical and Human Characteristics - a specific point distinguished by a particular character • Human/Environmental Interactions: Shaping the Landscape - the relationship between culture and landscape • Movement: Humans Interacting on Earth - interconnections • Regions: How They Form and Change -a space unified by some particular characteristic
22. The Spatial Perspective • Intellectual framework that lets geographers look at Earth in terms of relationships between places. • Geographers look at the spatial distribution of different phenomena and as how certain phenomena come to occur in certain places. • Geographers ask: • How do 2 places interact economically, socially, and culturally? • Why do some places have more in common than others? • How are social phenomena conveyed over time and space?
23. The Importance of Scale • Geographic scale refers to a conceptual hierarchy of spaces, from small to large, reflecting actual levels of organization in the real world. • Ex: neighborhood to urban area to metropolitan area to region. • Geographers wonder how processes at one scale may affect activities at other scales. • Geographers understand that patterns or analysis at large scales may not reflect apparent spatial differences at smaller scales.
24. The Region as a Concept • region = basic unit of analysis in human geography • allows geographers to group pieces of Earth’s surface are according to similarities • do not exist as well-defined units--conceptual constructions used for convenience and comparison
25. Regional Geography • Def: the study of regions • Regions vary in size; a region may be an entire continent, for example, North America, or a smaller area, such as southern Florida. • Regional geographers, no matter the size of the region under study, investigate the unique characteristics, patterns, and processes existent within that place.
26. Qualitative vs. Quantitative Data • Human geographers work with various types of data that come in two main forms: qualitative and quantitative. • Qualitative - associated with cultural or regional geography because they are more unique to and descriptive of places and processes. • Qualitative - not suited to statistical analyses and modeling and are often collected through interviews, empirical observations, or the interpretation of texts, artwork, old maps, and other archives. • Quantitative - uses rigorous mathematical techniques, are particularly important in economic, political, and population geography, as well as physical geography.
27. Idiographic vs. Nomothetic • Idiographic - facts or features unique to a particular place or region, such as its history or ethnic composition. • Nomothetic - concepts that are universally applicable. • Contrast is similar to the regional/systematic difference; regional geographers tend to be more idiographic, while systematic geography takes a nomothetic approach by seeking universal laws that can be applied broadly to numerous places on the Earth’s surface.
28. The Geoid • The term for the bumpy oblate spheroid that is the Earth’s surface. • An oblate spheriod is a sphere that is slightly bigger horizontally than vertically. • Approximately 8,000 miles in diameter and its circumference is about 25,000 miles.
29. Projection • The scientific method of transferring locations on Earth’s surface to a flat map. • Traditionally, done by placing light inside a translucent globe and projecting globe’s features on a piece of paper surrounding the globe. • Now, done with numerous, different, complicated mathematical equations
30. Map Distortion • All flat maps are distorted as a result of going from 3D to 2D; the only accurate representation of Earth’s surface is a globe. • Some projections distort certain features to preserve others. • Generally, major features that get distorted or preserved are shape, area, & direction.
31. When Projection Matters • Cartographers choose projections according to the purpose of the map. • Ex: a map of population density by country should use a projection that preserves area (e.g. an equal-area map) • Global-scale maps are much more distorted than maps of local places (e.g. state shapes & sizes do not change nearly as much as country shapes and sizes when projected
32. The Mercator Projection • advantages: very little distortion of shape; consistent direction; rectangular map • greatest disadvantage: area is grossly distorted toward the poles, making high-latitude places look much larger than they are • cylindrical projection - projected onto a cylindar
33. The Peters Projection • Cylindrical projection that retains accurate sizes of all the world’s landmasses • Reveals how large the landmasses near the equator actually are • Often seen as a political statement - an attempt to focus attention on the world’s poorest countries
34. The Fuller Projection • Maintains the accurate size and shape of landmasses but completely rearranges direction • Cardinal directions -- north, south, east, and west--no longer have any meaning
35. The Robinson Projection • Example of an attempt to balance projection errors • Does not maintain accurate area, shape, distance, or direction, but minimizes errors in each • Is aesthetically pleasing, so is frequently used by cartographers at organizations like the National Geographic Society (where it was made)
36. Azimuthal Projections • Planar projections - formed when a flat piece of paper is put over a globe with a light source inside • One of the poles is at center of the map, giving an impression of looking up or down at the Earth
37. Cartographic Scale • aka map scale = ratio between distance on a map and actual distance on Earth’s system • Ratio is constant despite units; ex: 1:200 means 1 unit on the map is equivalent to 200 of that same unit in reality. • On small scale maps, ratio between map units and ground units is small and map represents a larger piece of the Earth’s surface • On large scale maps, ratio between map units and ground units is large, meaning map represents a relatively small piece of the Earth’s surface.
38. Resolution • refers to map’s smallest discernible unit; basically it is the smallest thing visible on a map. • If an object has to be 330 feet long in order to show up on a map, then that map’s resolution is 330 feet.
39. Generalization • Averaging over details; in a cartographic context generalization results from scaling changes. • Small-scale maps have high generalization, or less detail, but show larger pieces of the Earth’s surface area. • Large-scale maps have less generalization, or more detail, but show smaller pieces of the Earth’s surface. • A map of the entire United States (small scale) will not show the small towns and villages that would appear on a map of a local area (large scale).
40. Reference vs. Thematic Maps • Form depends on the map’s purpose • Reference maps are used to navigate between places and include topographic maps, atlases, road maps, and other navigational maps. • Thematic maps display one or more variables across a specific space such as population variables, voting patterns, or economic welfare. • Many ways to display thematic data; some common methods include choropleth maps, proportional symbol maps, isoline maps, and cartograms.
41. Isoline Maps • Maps that use lines to represent quantities of equal value. • Most common example is a topographic map, where each line represents a constant elevation. • Lines spaced close together indicate a rapidly changing value, whereas lines far apart indicate little change over space. • Isolines can be used to show other values that vary continuously over space such as temperatures (e.g., in physical geography) or population density.
43. Proportional Symbols Maps • Size of the chosen symbol (e.g., circle, triangle, or flow line) indicates relative magnitude of some value for a given geographic region. • Flow lines often used to show movement of goods or people over space; lines get relatively thinner and thicker as values shrink or expand.
44. Dot Density Maps • use points to represent particular values; for example, cropland harvested where each dot represents 1,000 bushels of corn. • value comes from the ability to facilitate perception of spatial pattern; in example of corn cropland harvested, an obvious spatial pattern would emerge in the Midwest. • The disadvantage is that data that does not meet the threshold (e.g., only 999 bushels of corn harvested in a particular area) does not appear on the map.
45. Choropleth Maps • Use colors or tonal shadings to represent categories of data for given geographic areas; countries, states, or counties most commonly use polygons. • A map of population density by county in the United States might use five different colors to classify density values.