Compactly Representing Parallel Program Executions
This work presents a novel approach to compactly represent and profile parallel program executions. We differentiate between count-based and path-based profiling; while count-based profiles aggregate basic block executions and memory accesses, path-based profiles provide a more accurate sequence of executed blocks and accessed memory locations. We employ online compression techniques for generating compact path profiles, enabling efficient synchronization detection and control/data flow representation across threads. Our method aims to minimize overhead while maintaining compression efficiency and facilitating analysis of path profiles in sequential and parallel programs.

Compactly Representing Parallel Program Executions
E N D
Presentation Transcript
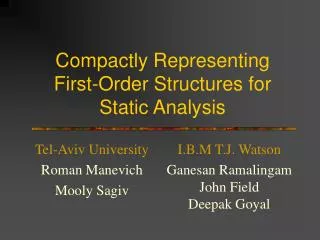
Compactly Representing Parallel Program Executions Ankit Goel Abhik Roychoudhury Tulika Mitra National University of Singapore
Path profiles • Profiling a program’s execution • Count based • Path based • Count based profiles are more aggregate • # of execution of the program’s basic blocks • # of accesses of various memory locations • Path based profiles are more accurate • Sequence of basic blocks executed • Sequence of memory locations accessed • Use Online compression to generate compact path profiles.
Organization • Compressed Path Profiles in Sequential Programs • Parallel Program Path Profiles • Compression Efficiency and Overheads • Data race detection over path profiles
Compressed Path - Example Uncompressed Path 123123 1 Compressed Representation S AA A 123 2 3 Control Flow Graph
Online Path Compression • A program path is a string over a finite alphabet • Alphabet decided by what we instrument • Control flow (Basic Blocks executed) • Data flow (Memory Locations accessed) • A string s is represented by a Context Free Grammar Gs: Language of Gs is {s} • Construction of Gs is online and not post-mortem • Start with trivial grammar & modify it for each symbol • No recursive rules (DAG representation) • Compression scheme – Nevill-Manning & Witten 97 • Application to program paths – Larus 99
Online Compression in action Path Executed Compressed Representation 1 S -> 1 12 S -> 12 123 S -> 123 1231 S -> 1231 12312 S -> 12312 S -> A3A A -> 12
Online Compression in action Path Executed Compressed Representation S -> A3A3 A -> 12 123123 S -> BB B -> A3 A -> 12 S -> BB B -> 123
Organization • Compressed Path Profiles in Sequential Programs • Parallel Program Path Profiles • Compression Efficiency and Overheads • Data race detection over path profiles
What to represent ? • Control/data flow in each program thread • Communication among threads • Synchronization (locks, barriers) • Unsynchronized shared variable accesses • Too costly to observe/record order of all shared variable accesses • We will represent • Compressed flow in each thread (via Grammar) • Communication via synchronizations (How ?)
Synchronization Pattern (Locks) lock Compute Pgm = P1 || P2 unlock lock unlock Memory P1 P2 Message Sequence Chart (MSC)
Synchronization Pattern (Barrier) ready Pgm = P1 || P2 Blocked ready go go Compute Compute P1 P2 Memory
Connection to MSCs Partial Order of MSC • Matches Observed Ordering • Total order in each thread • Ordering across threads visible via synchronization (msg. exchange) unlock lock Th. 1 Th. 2 Shared Mem. All synchronization ops. form a total order
A first cut • Instrument each thread to observe local control/data flow and global synch. • Represent path profile of P1 || P2 • Each thread’s flow as a Grammar – (G1, G2) • Contains synch. ops. as well. • All synchronization ops. as a list. • Associate entries in this list to the occurrence of synch. ops. in (G1,G2) • How to navigate the path profile ? • Zoom in to a specific lock—unlock segment of P1
Edge annotations a b (lock) c (unlock) x b (lock) c (unlock) y S 4 0 2 2 y a A x 0 1 b c Grammar for one thread
Locating synch. operations S 4 X 0 2 2 y n a A x Y } 0 1 b c n synch ops. Locating the 3rd synchronization operation Can find synch. segments by looking up global list.
So far • Control flow of each thread stored as a grammar • Synchronization ops. form a global list • Grammar of each thread annotated with counts • Easy searching of synchronization operations • What about shared data accesses ? • Sequence of memory locations accessed by a single LD/ST instruction can be compressed • Use a Grammar representation for this seq. as well
Further compression • Locations accessed by a memory operation • 10,14,18,22,26,54,58,62,66,70,98 • Online Compression of the string as grammar • 10(1), 4(4), 28(1), 4(4), 28(1) • Difference representation + Run-length encoding • Useful for detecting regularity of array accesses • Sweep through an array: A run of constant diffs. • Accessing a sub-grid of a multidimensional array
Organization • Compressed Path Profiles in Sequential Programs • Parallel Program Path Profiles • Compression Efficiency and Overheads • Data race detection over path profiles
Any better than gzip ? Compression % (2 Processors)
Scalability of Compression Compression % for our scheme
Concerns about Timing Overheads • Our scheme does not add substantial time overhead over grammar based string compression • Our experiments conducted using RSIM • Tracing overheads can be higher in a real multiprocessor • Can tracing distort program behavior ? • Possible solution • Trace minimal number of operations in a parallel program execution (Netzer 1993) to ensure deterministic replay • Collect compressed path profile during replay.
Organization • Compressed Path Profiles in Sequential Programs • Parallel Program Path Profiles • Compression Efficiency and Overheads • Data race detection over path profiles
Apparent Data races lock • Last unlock in Th. 1 (first unlock) • Next lock in Th. 1 (second lock) • Locate root-to-leaf paths of these ops. • Tree rooted at the least common ancestor of these ops. unlock lock unlock lock unlock lock unlock Th. 1 Th.2 Th.3 Mem. No Decompression of the grammar of Th. 1
Data race artifacts Sub := 1 A[1] := 0 X := Sub; Y := A[X] (artifact) X decides which addr. is accessed in Y := A[X] X is set by Sub:= 1 which is also in a data race. Detecting artifacts requires Data-flow Not captured by rd/wr sets in synch. segments Captured in our compact path profiles.
Summary • Compressed representation of the execution profile of shared memory parallel programs • Control and shared data flow per thread • Synchronization patterns across threads • Overall compression efficiency 0.25% -- 9.81% • Compression efficiency scalable with increasing number of processors • Application: Post-mortem debugging such as detecting data races
Other Applications • We do not capture actual order of unsynchronized shared memory accesses across processors • Can be useful in making architectural decisions such as choice of cache coherence protocol • Sufficient to maintain [Netzer 1993] • transitive reduction of program order on each proc. • shared variable conflict orders • Can we capture transitive reduction relation via annotations of WPP edges?