CVP Analysis
CVP Analysis. Cost, Volume, Profit. What is CVP?. Uses a specific cost-profit-volume formula to study the relationship of the costs, price, sales volume and profit. Profit = (price – vcost/unit)*Volume – Total Fixed Costs. Price and vcost are per unit. Developing the formula.

CVP Analysis
E N D
Presentation Transcript
CVP Analysis Cost, Volume, Profit
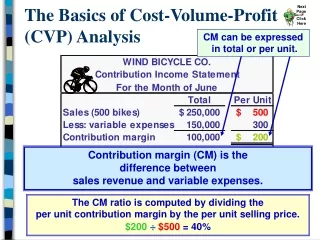
What is CVP? • Uses a specific cost-profit-volume formula to study the relationship of the costs, price, sales volume and profit. • Profit = (price – vcost/unit)*Volume – Total Fixed Costs. • Price and vcost are per unit.
Developing the formula • Profit = (price – vcost/unit)*Volume – Total Fixed Costs. • price and vcost are per unit. • P = (p – c)V – F (Basic Formula) • P = profit • p = price (per unit) • c = Variable cost/unit • F = total Fixed Costs • V = Sales Volume (units sold)
Example Using Basic Formula • P = (p – c)V – F • price (p) = $300/unit • vcost (c) = $100/unit • Total Fixed Costs = $50,000 • If you sell 1,500 units, what is the profit? • P = (300 – 100)1500 – 50000 • = (200)1500 – 50000 • = 300000 – 50000 • = $250,000
Using CVP • Breakeven analysis • Profit, price, Volume analysis
Using CVP for Breakeven Breakeven is the situation where no profit or loss is generated. • Income = Costs • In the Basic Formula, Profit = 0 Two ways to use: • Breakeven Volume: VBE • Breakeven price: pBE
Calculating Breakeven Volume • Breakeven Volume is the quantity that will generate Profit = 0 for given costs and price. • Using the formula, we need to determine what V is when P = 0. • P = (p – c)V – F • 0 = (p – c) VBE – F • F = (p – c) VBE • F/(p – c) = VBE • VBE is being use to denote specifically the Breakeven Volume.
Contribution Margin • VBE = F/(p – c) • The breakeven volume is calculated by Total Fixed costs divided by price minus variable costs. • (p – c) is often called the Contribution Margin (per unit) or Unit Contribution Margin. • Another way of looking at breakeven is it is the sales volume where Income = Costs.
Breakeven: Income = Costs • Income = Costs • P = (p – c)V – F • 0 = (p – c) VBE – F • 0 = p VBE – c VBE – F • p VBE = c VBE + F • p VBE is the income and c VBE + F are the total costs, Variable Costs + Fixed Costs.
Example of Breakeven Calculations • VBE = F/(p – c) • price (p) = $300/unit • vcost (c) = $100/unit • Total Fixed Costs = $50,000 • What the Breakeven volume? • VBE = 50000/(300 – 100) • VBE = 50000/200 • VBE = 250 units
Check & Validate… • Check: Income = Total Costs • p VBE = c VBE + F ?? • 300(250) = 100(250) + 50000 • 75000 = 25000 + 50000 • 75000 = 75000
Breakeven Graph INCOME = pV Breakeven: Income = Total Costs FIXED COSTS + VARIABLE COSTS FIXED COSTS VBE
Breakeven Price • Let’s say you know the volume and you want to know the price that will generate a breakeven situation: i.e. P = 0 • 0 = pBE V – c V – F • pBE V = c V + F • pBE = (c V + F)/V • Breakeven price is calculated by dividing the Total Costs by the Volume.
Example Breakeven price • pBE = (c V + F)/V or c + F/V • c = 100 (per unit) • F = 50000 • V = 1500 units • pBE = [100(1500) + 50000]/1500 • = [150000 + 50000]/1500 • = [200000]/1500 • = $133.33/unit • If you price the item at $133.33 then if you sell, 1500 units, you will Breakeven.
Example Breakeven price • pBE = (c V + F)/V or c + F/V • c = 100 (per unit) • F = 50000 • V = 1500 units • pBE = $133.33 • If you price it higher than $133.33, and you sell 1500 units, you will make a profit.
Using X5 from Tablet Sim • Default Values: • p = $265 (you can change this after SLP1) • c = $120 (does not change in the simulation) • Unit Contr. Margin = $145 • From Default Run Year 2012: • R&D costs = 7,260,000 • (33% of 22,000,000 budget, you decide allocation %) • Other Fixed Costs = 72,000,000 (does not change) • Total Fixed Costs = 79,260,000 (R&D + Other Fixed) • 2012 unit sales volume: 1,859,856
Using X5 from Tablet Sim • Let’s validate the results in the Sim and calculate Profit • P = (p – c)V – F • P = (265 – 145) 1,859,856 – 79,260,000 • = (120) 1,859,856 – 79,260,000 • = 223,182,720 - 79,260,000 • = 143,922,720 • Profit from Default Sim for X5 in 2012 = 143,922,720
Using X5 from Tablet Sim • Let’s estimate what will happen in 2013 if we lower R&D and we lower the price. • R&D% = 10% (of 20,000,000) • R&D = 2,000,000 • Price p = $225 (down from $250 by 15%) • Sales Volume V = 1,427,666 (from 2013 default run) • Profit = (225 – 145) 1,427,666 – 74,000,000 • = (80) 1,427,666 – 74,000,000 • = 114,213,280 – 74,000,000 • = 40,213,280 • Profit = 92,059,892 from 2013, default run
Using X5 from PDA Sim • So if you lower your price to $225 and decrease R&D and the volume does not change from the default volume, you will earn less profit in 2013 that you did in the default run. • BUT, if you lower the price will that help to increase the volume? • Maybe, but what does the volume need to be to obtain the same profit that was earned in 2013, default run (92,059,892)
Using X5 from Tablet Sim • Profit, P = 92,059,892 • Volume = ? • P = (p – c)V – F • (P + F)/(p – c) = V • (92,059,892 + 74,000,000)/(85) = V • 166,059,892/ 80 = 2,075,748.65 • V = 2,075,749 units to achieve the same profit • If you lower the price to $225 and reduce the R&D to 10%, does the reduced price cause an increase in Volume so that the profit is the same?
Determining Strategy: X5 Example • Default run 2013 • p = 265 • c = 145 • Unit Contr. Margin = 120 • R&D (33%) = 7,260,000 • Other Fixed = 72,000,000 • Profit = 92,059,892 • Volume = 1,427,666 • Possible strategy 2013 • p = 225 • c = 145 • ucm = 80 • R&D (10%) = 2,000,000 • Other Fixed = 70,000,000 • Profit = 81,690,327 • Volume = 2,075,749 If you lower price from $250 to $225 in 2007, will volume go up to or higher than 81,690,327
Breakeven Formulas • P = (p – c)V – F • For Breakeven, set P = 0 Breakeven Volume • VBE = F/(p – c) Breakeven Price • pBE = (c V + F)/V or • pBE = c + F/V • REMEMBER: in the Tablet Sim, you need to consider that R&D is part of Fixed Costs, so here F = Fo + R
Other CVP Formulas Use F = Fo + R (sim fixed costs) • Price, for a given Profit, Volume and Costs • p* = (P + Fo + R + cV) / V • Volume, for a given price, Profit and Costs • V* = (P + Fo + R) / (p – c)
Application of CVP in the PDA Sim • When should you use Breakeven? • How do you deal with multiple years? • How do you deal with multiple products? • Give these questions some thought. • Experiment with CVP.
USING THE CVP CALCULATOR An Example for X5 in the Tablet SIM
Default X5 2012 Price: $265 R&D%: 33% X5 Financials for 2012
USING CVP Calculator: Variable cost/unit: $145 Note that the results from the CVP Calculator are nearly the same as you get in the SIM. The only difference is because the SIM must be using 33.3333% for the R&D Allocation and the CVP Calculator is using 33%. So we will ignore the difference.
Now let’s develop a Revised Strategy Now, let’s try to develop a different price and R&D allocation for 2012 for our Revised Strategy using the • CVP Calculator. Should we lower R&D or increase it? Should we lower the price or increase it? How much profit do we want? How much will we sell? • Let’s lower the R&D%, say down to 15% - why? I will leave that up to you decide why we might want to do this. • Let’s leave the price the same for this first estimate: $265. • And let’s shoot for the same profit: $143,922,711 • If you put these into the CVP Calculator, this says you need less volume: 1,826,856 units.
What price if Volume does not change? • Price = ? • Same volume as default run • Same profit as default run • R&D%: 15% Price = $262.87
X5 Financials for 2006 What happens in SIM? • Let’s run the sim with our revised strategy for X5 for 2012. • Price: $263 • R&D%: 15%
Results do not match!! • Volume sold: 1,928,810 • Profit earned: 152,299,584 • We don’t get the same results that were predicted by the CVP!! In the CVP we used a Volume of: 1,859,856 But in the SIM, when we lowered the price just a bit down to $263, we got a volume of: 1,928,810. We will get this same result in the CVP calculator if we put in the actual profit earned in the SIM
Why does the SIM not match your predictions with the CVP Calculator? • The SIM gives you the results based on your inputs of price and R&D% • It will determine how much you sell based on the price – usually a lower price will generate a higher sales volume and vice versa, depending on the price elasticity. • The CVP calculator does not know the price:demand curve – it is simply telling you how much you need to sell for a given Price and a Target Profit.
Some final thoughts • So what is missing is the relationship between price and demand. • Demand is based on based price and the performance (how much is being spent on R&D). • You need to use CVP to help you determine or predict a price in your revised strategy. • Then based on the results you get, you can begin to understand the price:demand relationship. • That is why you get to run the SIM several times as you learn more about price:demand. • And of course demand is related to how much you spend on R&D. • And each product is more or less sensitive to price and product development efforts.