Maximizing Profitability through CVP Analysis Methods
Learn how Cost-Volume-Profit (CVP) analysis helps optimize business decisions by calculating break-even points and forecasting results. Understand the equation, contribution margin, and graphical methods for CVP analysis and their limitations.

Maximizing Profitability through CVP Analysis Methods
E N D
Presentation Transcript
Alfred Nobel University, Dnipropetrovsk CVP-analysis Darya Melnykova 2016
OUTLINE • CVP analysis and its functions. • The objective of CVP analysis. • Methods of calculation of BEP: • the equation method; • the contribution margin method; • the graphical method. • CVP limitations.
CVP analysis One of the most important decisions that needs to be made before any business even starts is how much they need to sell in order to break-even. By ‘break-even’ we mean simply covering all the costs without making a profit. This type of analysis is known as ‘cost-volume-profit analysis’.
Functions of CVP-analysis • Optimizing proportions between variables and fixed costs. • Optimizing proportions between a price and volumes of sales of products. • Minimizing an enterprise risk. • Estimating and forecasting final results.
The objective of CVP analysis CVP analysis looks first of all at the effects of different levels of activity on the financial results of a business. The reason for the particular focus on sales volume is because, in the short-run, sales price, and the cost of materials and labor, are usually known with a degree of accuracy. • For example: Company “A”:
The equation method Total revenue – total variable costs – total fixed costs = Profit (USP x Q) – (UVC x Q) – FC = P (50Q) – (30Q) – 200,000 = P(50Q) – (30Q) – 200,000 = 0 20Q – 200,000 = 0Q = 10,000 units
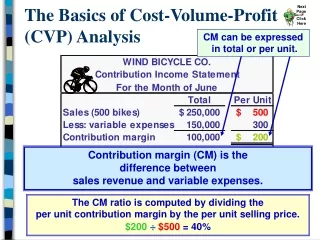
The contribution margin method (USP x Q) – (UVC x Q) – FC = P(USP – UVC) x Q = FC + PUCM x Q = FC + PQ = FC + P UCM Applying this approach to Company A we get: UCM = 20, FC = 200,000 and P = 0.Q = FC UCMQ = 200,000 20 Therefore, Q = 10,000 units
CVP limitations • CVP analysis is invaluable in demonstrating the effect on an organization that changes in volume, costs and selling prices have on profit. • All other variables, apart from volume, remain constant. • The total cost and total revenue functions are linear. • Costs can be divided into a component that is fixed and a component that is variable. • Fixed costs remain constant over the 'relevant range'.
References • http://www.accaglobal.com • Managerial Accounting 1; Okhotnik, Pyrec • http://infostart.ru/ • https://www.lynda.com/Business-Accounting/CVP