Download
1 / 37
570 likes | 4.19k Vues
CVP and Arterial Monitoring. Outline. Direct Arterial Monitoring Transducer Troubles CVP Monitoring and its clinical significance. Direct Arterial Monitoring. Arterial cannulation w/ continuous pressure waveform display remains the accepted standard for BP monitoring

E N D
Outline • Direct Arterial Monitoring • Transducer Troubles • CVP Monitoring and its clinical significance
Direct Arterial Monitoring • Arterial cannulation w/ continuous pressure waveform display remains the accepted standard for BP monitoring • Indications and Advantages • Frequent ABG’s • Continuous real-time monitoring when rapid, moment-to-moment BP changes are anticipated, i.e. CV instability, major fluid shifts or EBL • Failure of indirect BP monitoring i.e. morbid obesity, burned extremity • Intra-aortic balloon counterpulsation • Deliberate induced induced hypotension • Cardiac surgery for cardiopulmonary bypass • Major vascular surgery • Administration of vasoactive drug infusions
Natural Frequency and Damping • Left ventricular ejection initiates a pressure wave that is propagated down the aorta toward the periphery • The arterial BP waveform is a periodic complex wave, reproduced by Fourier analysis : a technique that recreates the original pressure wave by summing a series of simple sine waves of various amplitudes and frequencies • The original pressure wave has a characteristic periodicity that is called the Fundamental Frequency, which is equal to the pulse rate • Each measuring system has a natural frequency about which it can oscillate
Natural Frequency and Damping • If the frequency of the monitored pressure waveform approaches the natural frequency of the measuring system, the system will resonate and pressure waveforms recorded on the monitor will appear exaggerated (Resonance or Ringing) • Damping prevents a system from overshooting after responding to a change, particularly at frequencies close to the natural frequency of the system
Overdamping • Overdamping causes slurred upstroke, absent dicrotic notch, and loss of fine detail • Causes include blood clots, air bubbles in the tubing, and kinked catheters
Underdamping • Underdamping produces exaggerated peaks and troughs in the waveform • It can cause falsely high systolic pressures and low diastolic pressures • Causes include long connecting lines (>1.4 mm), small tubing (<1.5 mm internal diameter), or when the catheter occlude the vessel
Transducer Leveling and Zeroing • The pressure transducer is exposed to atmospheric pressure to establish the zero pressure reference value against which all intravascular pressures are measured • In the supine patient, pressure transducers are leveled most often to the midchest position in the midaxillary line • In other than supine positions (head injuries, CHF etc.), the transducer should be placed at the level of the aortic root (Chest 2001;120:1322-1326) • The principle behind this is that the proper level for a transducer to negate the effects of hydrostatic pressure is always at the top of the fluid column in the system being analyzed (ie. Aortic root)
continued • The central MAP and particularly the aortic mean is the key component in coronary and cerebral perfusion as well as the pressure that is sensed by baroreceptor mechanisms • This is the pressure that is indirectly measured using standard noninvasive BP techniques
The Arterial Waveform in relation to the EKG • Systolic Upstroke • Systolic Peak Pressure • Systolic Decline • Dicrotic Notch • Diastolic Runoff • End-diastolic Pressure
Complications • Ischemia • Hemorrhage • Thrombosis • Embolism • Cerebral air embolism (retrograde flow assoc. w/ flushing) • Aneurysm formation • Arteriovenous Fistula formation • Skin necrosis • Infection (Stopcocks are an important source)
Indications for CVP • Central Venous Pressure Monitoring • Pulmonary artery catheterization and monitoring • Transvenous cardiac pacing • Temporary hemodialysis • Drug administration: Concentrated vasoactive drugs Hyperalimentation Chemotherapy Agents irritating to peripheral veins • Rapid infusion of large volumes : Trauma and Major surgery • Aspiration of Air Emboli • Inadequate peripheral IV access • Sampling site for repeated blood testing
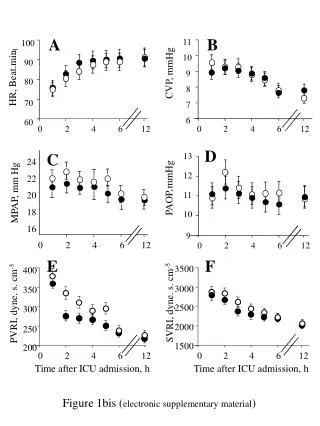
Normal CVP • “Normal” CVP • A normal value in a spontaneously breathing patient is approximately 5-10cm H2O • This rises about 3-5cm H2O during mechanical ventilation
What does this number mean? • CVP is a measure of the pressure in the right atrium, which reflects changes in right ventricular end-diastolic pressure • Estimates cardiac function and blood volume. It does not measure either of these directly - it must be interpreted! • Determined by the function of the right heart and the pressure of venous blood in the vena cava
CVP and Left Heart Pressures • In a normal patient the CVP closely resembles the left atrial pressure and can be used to estimate it • This depends on the assumption that there is no right ventricular disease and normal pulmonary vascular resistance
CVP Waveform • Three Peaks (a, c, v) • Two Descents (x, y)
“a” wave • Caused by atrial contraction (follows the P-wave on EKG) • End diastole • Corresponds with “atrial kick” which causes filling of the right ventricle
“c” wave • Atrial pressure decreases after the “a” wave as a result of atrial relaxation • The “c” wave is due to isovolemic right ventricular contraction; closes the tricuspid valve and causes it to bow back into the right atrium • Occurs in early systole (after the QRS on EKG)
“x” descent • Atrial pressure continues to decline due to atrial relaxation and changes in geometry caused by ventricular contraction • Mid-systolic event • “Systolic collapse in atrial pressure”
“v” wave • The last atrial pressure increase is caused by filling of the atrium with blood from the vena cava • Occurs in late systole with the tricuspid still closed • Occurs just after the T-wave on EKG
“y” descent • Decrease in atrial pressure as the tricuspid opens and blood flows from atrium to ventricle • “Diastolic collapse in atrial pressure”
Measuring CVP • The peak of the “a” wave coincides with the point of maximal filling of the right ventricle • Therefore, this is the value which should be used for measurement of RVEDP • Machines just “average” the measurement • Should be measured at end-expiration
Respiratory Effects • During spontaneous ventilation, a decrease in pleural and pericardial pressures occurs during inspiration - these are pressures that are transmitted to the right atrium • This causes a decrease in the measured CVP (but transmural pressure may actually INCREASE) • Mechanical ventilation causes the opposite effect during an forced inspiratory breath
Pleural and pericardial pressures are almost equal to atmospheric pressure at end-expiration This is true with both spontaneous and mechanical ventilation This point in time provides the best estimate for transmural pressure and cardiac preload Respiratory Effects (cont.)
Things to remember… • There are three parts of the waveform that are systolic events (c, x, v) • There are two parts of the waveform that are diastolic events (a, y) • The EKG is used as a reference to properly identify the parts of the waveform • The terms systole and diastole refer to VENTRICULAR events only
Things to remember… • The CVP wave represents changes in pressure, not changes in volume • Mnemonic for the CVP wave • “a” wave due to atrial contraction • “c” wave due to tricuspid closure and ventricular contraction • “v” wave due to venous filling of atrium
Tachycardia and CVP • A short PR interval can cause the “a” and “c” waves to fuse • Tachycardia reduces the time spent in diastole, causing a short “y” descent • This can make the “v” and “a” waves appear to merge
Bradycardia and CVP • Causes each wave to become more distinct • “h” wave may become evident - plateau wave in mid- or late diastole • The “h” wave has very little clinical significance
Clinical Examples • Atrial Fibrillation • Junctional Rhythm • Ventricular Pacing • Tricuspid Regurgitation/Stenosis • Pericardial Constriction • Cardiac Tamponade
Atrial Fibrillation • The “a” wave disappears (no atrial contraction or “kick”) • The “c” wave becomes more prominent (atrial volume is higher at beginning of systole because the atrium did not empty)
Junctional Rhythm • Atrial contraction occurs during systole (when the tricuspid valve is closed) • The blood has no place to go so the pressure goes up much more than usual, resulting in a large “a” wave • Cannon “a” wave • Also seen with A-V dissociation, ventricular pacing, etc.
Tricuspid Regurgitation • The right atrium gains volume during systole - so the “c” and “v” wave is much higher • The right atrium “sees” right ventricular pressures and the pressure curve becomes “ventricularized”
Tricuspid Stenosis • Problem with atrial emptying and a barrier to ventricular filling on the right side of the heart • Mean CVP is elevated • “a” wave is usually prominent as it tries to overcome the barrier to emptying • “y” descent muted as a result of decreased outflow from atrium to ventricle
Pericardial Constriction • Limited venous return to heart, elevated CVP, end-diastolic pressure equalization in all cardiac chambers • Prominent “a” and “v” waves, steep “x” and “y” descents • Characteristic M or W pattern, dip and plateau (square root sign)
Cardiac Tamponade • Changes in atrial and ventricular volumes are coupled, so total cardiac volume does not change when blood goes from atrium to ventricle • CVP becomes monophasic with a single, prominent “x” descent with a muted “y” descent • Similar to pericardial constriction but not exactly the same
Central Line Complications Complications Total Fatalities • Cardiac Tamponade 11 10 • Wire or catheter embolism 12 0 • Vascular injuries (non-pulmonary artery) 13 5 • Hemothorax 6 4 • Hydrothorax 3 1 • Carotid artery injury 3 0 • Subclavian a. aneurysm 1 0 • Pulmonary artery rupture 2 2 • Pneumothorax 7 1 • Air embolism 1 0 • Fluid extravasation 1 0 • Total 48 20 • (Central Line complications from ASA Closed Claims Project. ASA Newsletter 1996;60:222-5