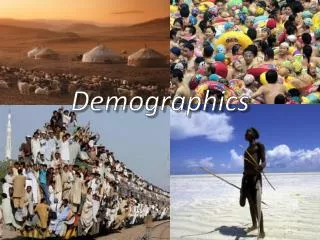
Demographics
Demographics. Demographics. Demography is the study of human populations. . Demographics. When we analyze data, we express the information in rates : Natural Increase Rate (N.I.R.) is a measure of how a population changes because of people being born, and people dying.


Demographics
E N D
Presentation Transcript
Demographics • Demography is the study of human populations.
Demographics When we analyze data, we express the information in rates: • Natural IncreaseRate (N.I.R.)is a measure of how a population changes because of people being born, and people dying. • Birth Rate (B.R.) = number of births per 1000 people • Death Rate (D.R.) = number of deaths per 1000 people • N.I.R. = B.R. – D.R
Demographics • Net Migration Rate (N.M.R.) is the difference between how many people enter a country (immigrate) and how many people leave the country (emigrate). • Immigration Rate (I.R.) = number of immigrants per 1000 people • Emigration Rate (E.R.) = number of people leaving a country (emigrants) per 1000 people • N.M.R. = I.R – E.R.
Demographics • Population Growth Rate (P.G.R.) combines Natural Increase Rate and Net Migration Rate to calculate the overall growth of a country’s population. It is usually expressed as a %. • P.G.R = N.I.R + N.M.R
Demographics Population Pyramids are used to compare a country’s population for different years (or to compare different countries).
Demographics The dependency load is the part of the population that needs to be supported. It is made up of two components: the 0–14 age group and the 65+ age group.
Demographics As a country becomes more industrialized (developed), predictable changes occur. • This is explained by Demographic Transition Model, created by Thomas Malthus. Stage 1: high B.R., high D.R. Stage 2: high B.R., declining D.R. Stage 3: declining B.R., stabilizing D.R. Stage 4: B.R. close to D.R.
Demographics • A specific pattern of population growth has occurred in many developed nations during the past 60 years. Baby Boom Baby Echo Births Generation Y Generation X 1965 2025 1945 1985 2005