Understanding Demographics and Health Needs: Insights from 2-1-1 Service Requests
This study explores the demographics of individuals utilizing 2-1-1 services, revealing that 86% are women, with 68% living in homes with incomes under $15,000. A significant percentage of callers lack health insurance (41%) and have limited educational attainment (27% under high school). The study also highlights that many callers have considerable cancer risks, with 69% needing at least one cancer control service. Follow-up data indicates that referrals can lead to changes in behavior and health services utilization. Understanding these trends can inform better health interventions.


Understanding Demographics and Health Needs: Insights from 2-1-1 Service Requests
E N D
Presentation Transcript
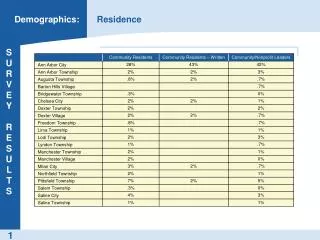
Demographics - 86% women- 53% child < 18 in home - 68% < $15,000 - 27% < H.S. education- 45% out of work- 41% no health insurance Kreuter MW, et al (2012) Am J Prev Med Purnell J, et al. (2012) J Hlth Care Poor Underserved. Eddens K, et al. (2011) J SocServ Res.
2-1-1 service requests - 77% bills- 42% home and family - 9% employment - 8% health- 6% housing- 10% other Kreuter MW (2012) Am J Prev Med
Abusive partner Rent Child behavior Sick parent
Cancer control survey of callers - colonoscopy- mammogram- HPV (self) - HPV (daughter)- Pap test- quitting smoking- smoke-free home
Cancer control needs - 69% need at least one- 39% need two or more- 16% need three or more Purnell J, et al. (2012) J Hlth Care Poor Underserved.
What we learned - 2-1-1 callers have significant cancer risks- These can be quickly identified though screening - When offered prevention referrals, many accept- Callers think it’s an appropriate role for 2-1-1s
What we still needed to learn - Will callers act on health referrals?- Will referrals lead to preventive health behaviors?
Contacted any referral1-month follow-up(n=772) 40 30 20 10 0 Percent Kreuter MW, et al. (2012) Am J Prev Med.
Got mammogram or Pap test 4-month follow-up (n=429) -.139* Navigation .434** Contacted referral Changed behavior .328** .000 1 month 4 months Tailoring -.175 * p < .05; ** p < .01
Full household smoking ban 3-month follow-up (n=500) 25 20 15 10 5 0 Percent P < .003
In-home monitoring (3-mo FU; n=98)Nicotine concentration (µg/m3) 4.0 3.0 2.0 1.0 0 Mean P < .004