Download
1 / 25
250 likes | 273 Vues
Explore the causes and impacts of climate change, from atmospheric compositions to land-use changes, and the critical role of feedback mechanisms. Learn about current research and the need for better data to enhance climate models and predictions.

E N D
Climate Change in the Atmosphere: Forcings and Feedbacks David Stevenson NERC/Environment Agency Advanced Research Fellow (Lecturer in Atmospheric Modelling from 1st April)
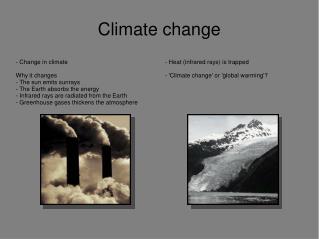
In what ways has climate changed? What has caused recent climate change?
And what will be thecauses of futureclimate change? Surface temperature projections (IPCC, 2001)
Future changes in these likelyto be most important forcing Climate forcings • Changes in atmospheric composition • Greenhouse gases • Aerosols • Changes in land-use (planetary albedo) • Deforestation/afforestation • External forcings • Solar variability • Large volcanic eruptions • Changes in Earth’s orbit etc. (>104 yrs)
Land-use change: e.g. foreststo pasture – increases albedo Warming from increasesin GHGs +3 W m-2 Solarforcing General coolingfrom increasesin aerosols –but high uncertainty
Climate Feedbacks • Forcings have knock-on effects in the climate system, e.g., Temperature • water vapour; H2O is a GHG, +ve feedback • sea ice; ocean is darker than ice, +ve feedback • ΔClouds, ? Feedback • ΔEcosystem sources/sinks of GHGs & aerosols, +ve feedbacks • ΔChemistry… ΔO3, Δoxidising capacity, generally –ve feedbacks • Models simulate feedbacks differently – leads to a range of model climate sensitivities • Big question: What is the real climate sensitivity?
Why the big range in predicted temperature? Partly uncertainty in future emissions; partly uncertainty in climate sensitivity
What do we need? • Better observations of climate, past and present (can we derive climate sensitivity from observations?) • Better estimates of emissions and atmospheric budgets, and hence concentrations of GHGs and aerosols (forcings) • Better representation of climate feedbacks in models, and hence better constrained estimates of climate sensitivity(feedbacks)
Some examples of current atmospheric/oceanic global change research at Edinburgh
OwenEmbury StephanMatthieson ChrisMerchant ChrisOld HelenKettle Observing and Modelling the surface Ocean
Improved cloud screening algorithms for SST retrievals Currently usedoperationally New version –better coverage
Improved modelling of diurnal ocean-atmosphere coupling Arabian Sea 0.17 m 5.0 m LOTUS Model 0.6 m 5.0 m Obs Old model New model Root mean square error in diurnal amplitude / K
Saharan Dust, 48 hours of data from August 2005 Dust is an important correction for satellite SSTs; also an important climate forcing.
BobHarwood HughPumphrey Ian MacKenzie MarkFilipiak CarlosJimenez CoryDavis LiangFeng Data retrieval and analysis from NASA’s Earth Observing System Microwave Limb Sounder on board the AURA satellite
KeithWeston DavidStevenson RuthDoherty RichardDamoah MassimoVieno Modelling Global and Regional Atmospheric Composition
Year 2000 tropospheric NO2 columns Observed (GOME)(mean of 3 methods) Model(ensemble mean) (10:30am local sampling in both cases) Courtesy Twan van Noije, Henke Eskes
Change in tropospheric O32000-2030 under 3 scenarios Annual Zonal Mean ΔO3 / ppbv Annual Tropo-spheric Column ΔO3 / DU ‘Optimistic’ IIASA MFR SRES B2 economy + Maximum Feasible Reductions ‘Likely’ IIASA CLE SRES B2 economy + Current AQ Legislation ‘Pessimistic’ IPCC SRES A2High economic growth +Little AQ legislation
Climate impact of aircraft NOx emissions Short-term warming from ozone Plus minor ozone long-term cooling Long-term cooling from methane ΔNOx NB negative scale expanded ΔO3 NB negative scale expanded ΔOH ΔCH4 Decay with e-folding timescale of 11.1 years
Climate statistics and Phenology RoyThompson
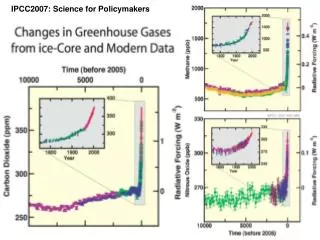
More to Global Change than just Climate Change When this oak tree was a sapling, maybe 200 years ago, the climate was perhaps 1K cooler. Its main ‘food’ is CO2 – over its life, ambient levelshave increased from 280 ppbv to 370 ppbv Deposition of nitrogen – an essential nutrient – may have increased 10-fold or more Exposure to ozone – a damaging pollutant – may have increased 3-fold or more
What do we need? • Better observations of climate, past and present (can we derive climate sensitivity from observations?) • Better estimates of emissions and atmospheric budgets, and hence concentrations of GHGs and aerosols (forcings) • Better representation of climate feedbacks in models, and hence better constrained estimates of climate sensitivity(feedbacks)