Why use Multivariate Autoregressive Modeling?
Why use Multivariate Autoregressive Modeling?. S.E. Hampton, NCEAS, UCSB, hampton@nceas.ucsb.edu, 7 July 2007. S.E. Hampton, NCEAS, UCSB, hampton@nceas.ucsb.edu, 7 July 2007. Temperature Nutrients Photoperiod. Storm activity Fishing pressure.

Why use Multivariate Autoregressive Modeling?
E N D
Presentation Transcript
Why use Multivariate Autoregressive Modeling? S.E. Hampton, NCEAS, UCSB, hampton@nceas.ucsb.edu, 7 July 2007
S.E. Hampton, NCEAS, UCSB, hampton@nceas.ucsb.edu, 7 July 2007
Temperature Nutrients Photoperiod ... Storm activity Fishing pressure ... S.E. Hampton, NCEAS, UCSB, hampton@nceas.ucsb.edu, 7 July 2007
Temperature Nutrients Photoperiod ... Storm activity Fishing pressure ... S.E. Hampton, NCEAS, UCSB, hampton@nceas.ucsb.edu, 7 July 2007
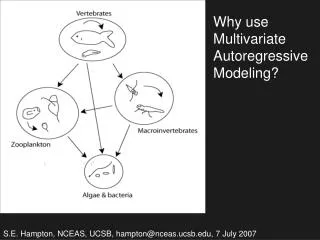
Endogenous interactions S.E. Hampton, NCEAS, UCSB, hampton@nceas.ucsb.edu, 7 July 2007
And exogenous forces... Temperature ... Nutrients .... Photoperiod ... Storm activity ... Fishing pressure ... S.E. Hampton, NCEAS, UCSB, hampton@nceas.ucsb.edu, 7 July 2007
Biologically plausible interactions... Temperature ... Nutrients .... Photoperiod ... Storm activity ... Fishing pressure ... S.E. Hampton, NCEAS, UCSB, hampton@nceas.ucsb.edu, 7 July 2007
Let’s reduce this set of interactions to those that are strongest.... TotalPhosphorus Hampton, Scheuerell, & Schindler 2006 S.E. Hampton, NCEAS, UCSB, hampton@nceas.ucsb.edu, 7 July 2007
Experiments & Observation S.E. Hampton, NCEAS, UCSB, hampton@nceas.ucsb.edu, 7 July 2007
Long-term observational & experimental data S.E. Hampton, NCEAS, UCSB, hampton@nceas.ucsb.edu, 7 July 2007
Can we characterize food web interactions based on monitoring data? S.E. Hampton, NCEAS, UCSB, hampton@nceas.ucsb.edu, 7 July 2007
For example.... Experimental evidence for food web effects of cyanobacteria blooms S.E. Hampton, NCEAS, UCSB, hampton@nceas.ucsb.edu, 7 July 2007
Evidence for these relationships in natural data? S.E. Hampton, NCEAS, UCSB, hampton@nceas.ucsb.edu, 7 July 2007
ln Cryptomonad bv ln Daphnia ind L-1 ln Oscillatoria biovolume Evidence for these relationships in natural data? S.E. Hampton, NCEAS, UCSB, hampton@nceas.ucsb.edu, 7 July 2007
Lake Washington food web Nutrients Temperature S.E. Hampton, NCEAS, UCSB, hampton@nceas.ucsb.edu, 7 July 2007
Multispecies Autoregressive Models (MARs) Ives, Dennis, Cottingham, & Carpenter. 2003. Ecol. Monogr. 73(2) Log abundance of species i tomorrow Log abundance of species i today xi(t+1) = xi(t) + ai + [S bi,j xj(t)] + [S ci,k uk(t)] Species-specific constant S.E. Hampton, NCEAS, UCSB, hampton@nceas.ucsb.edu, 7 July 2007
Multispecies Autoregressive Models (MARs) Ives, Dennis, Cottingham, & Carpenter. 2003. Ecol. Monogr. 73(2) Log abundance of species i tomorrow Effect of species j on species i Log abundance of species i today xi(t+1) = xi(t) + ai + [S bi,j xj(t)] + [S ci,k uk(t)] Species-specific constant Log abundance of species j today S.E. Hampton, NCEAS, UCSB, hampton@nceas.ucsb.edu, 7 July 2007
Multispecies Autoregressive Models (MARs) Ives, Dennis, Cottingham, & Carpenter. 2003. Ecol. Monogr. 73(2) Log abundance of species i tomorrow Effect of species j on species i Log abundance of species i today Effect of environmental variable k on species i xi(t+1) = xi(t) + ai + [S bi,j xj(t)] + [S ci,k uk(t)] Species-specific constant Level of environmental variable k today Log abundance of species j today S.E. Hampton, NCEAS, UCSB, hampton@nceas.ucsb.edu, 7 July 2007
xi(t+1) = xi(t) + ai + [S bi,j xj(t)] + [S ci,k uk(t)] • Multispecies Autoregressive Models (MARs) • Coefficients represent interaction strength Ives, Dennis, Cottingham, & Carpenter. 2003. Ecol. Monogr. 73(2) S.E. Hampton, NCEAS, UCSB, hampton@nceas.ucsb.edu, 7 July 2007
MAR food web construction for Lake Washington TotalPhosphorus S.E. Hampton, NCEAS, UCSB, hampton@nceas.ucsb.edu, 7 July 2007
MAR food web construction for Lake Washington 1962 - 1972 TotalPhosphorus Hampton, Scheuerell, & Schindler 2006 S.E. Hampton, NCEAS, UCSB, hampton@nceas.ucsb.edu, 7 July 2007
MAR food web construction for Lake Washington 1962 - 1972 TotalPhosphorus Hampton, Scheuerell, & Schindler 2006 S.E. Hampton, NCEAS, UCSB, hampton@nceas.ucsb.edu, 7 July 2007