Download
1 / 43
430 likes | 627 Vues
Analyzing Financial Statements. Some Users of Financial Statements. Government regulatory agencies. Individuals. Businesses. Taxing authorities. Investors and creditors. Nonprofit organizations. Individual Company Factors. Industry Factors. Economy-wide Factors.

E N D
Some Users of Financial Statements Government regulatory agencies Individuals Businesses Taxing authorities Investors and creditors Nonprofit organizations
IndividualCompanyFactors IndustryFactors Economy-wideFactors Understanding The Business Lend? Sell on credit? Invest? Invest? No Yes
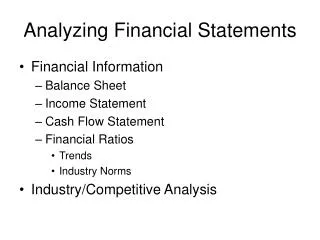
Analyzing Financial Statements • Dollar and percentage • changes on statements • (Horizontal Analysis)/ • Trend Analysis Analytical techniques used to examine relationships among financial statement items • Common-size statements • (Vertical Analysis) • Ratios
Horizontal Analysis Horizontal analysis shows the changes between years in the financial data in both dollar and percentage form.
Horizontal Analysis $12,000 – $23,500 = $(11,500) ($11,500 ÷ $23,500) × 100% = 48.9%
Trend Percentages Trend percentages state several years’ financial data in terms of a base year, which equals 100 percent.
Trend Percentage Current Year Amount Base Year Amount × 100% = Trend Analysis
Trend Analysis Berry Products Income Information For the Years Ended December 31 By analyzing the trends for Berry Products, we can see that cost of goods sold is increasing faster than sales, which is slowing the increase in gross margin.
Vertical Analysis Vertical analysis focuses on the relationships among financial statement items at a given point in time.A common-size financial statement is a vertical analysis in which each financial statement item is expressed as a percentage.
Common-Size Statements Sales is usually the base and is expressed as 100%.
Common-Size Statements In balance sheets, all items usually are expressed as a percentage of total assets(or total liabilities+equity).
Ratios may be interpreted by comparisonwith ratios of earlier periods, other companies, or withindustry average ratios. Ratios may vary because of thecompany’s industry characteristics,nature of operations, size, andaccounting policies. Interpreting Ratios
Limitations of Financial Statement Analysis Differences in accounting methods between companies sometimes make comparisons difficult. We use the LIFO method to value inventory. We use the average cost method to value inventory.
Industry trends • Changes within the company • Consumer tastes • Technological changes • Economic factors Limitations of Ratio Analysis Analysts should look beyond the ratios.
Gross Margin Percentage Gross Margin Sales = Gross Margin Percentage This measure indicates how much of each sales dollar is left after deducting the cost of goods sold to cover expenses and provide a profit.
Net Income* Average Number of Shares Outstanding for the Period EPS = Earnings per (Common) Share (EPS) *If there are preferred dividends, the amount is subtracted from net income. $5,761 (1,970 + 2124) ÷ 2 EPS = = $2.81 Average number of shares based on the numberof shares at the beginning and end of the year. Earnings per share is probably the single most widely watched financial ratio.
Current Market Price Per ShareEarnings Per Share P/E Ratio = $45$2.35 P/E Ratio = = 19X Price/Earnings (P/E) Ratio Market tests relate the current market price of a share of stock to an indicator of the return that might accrue to the investor. A recent price for Home Depot stock was $45 per share. This ratio measures the relationship between the current market price of the stock and its earnings per share.
Dividend Payout Ratio Dividends Per Share Earnings Per Share = Dividend Payout Ratio $2.00 $2.42 = = 82.6% Dividend Payout Ratio This ratio gauges the portion of current earnings being paid out in dividends. Investors seeking dividends (market price growth) would like this ratio to be large (small).
Dividend Yield Dividends Per Share Market Price Per Share = Dividend Yield $0.675$34 = = 2 % Dividend Yield Ratio Home Depot paid dividends of $.675 per share when the market price was $34 per share. This ratio is often used to compare the dividend-paying performance of different investment alternatives.
Return on Assets Net Income + Interest Expense (net of tax) Average Total Assets = Return on Assets $5,761 + ($392 × (1 - .34)) ($52,263 + $44,405) ÷ 2 = = 12.5% Return on Total Assets Corporate tax rate is 34%. This ratio is generally considered a measure of a company’s profitability.
Return on Common Stockholders’ Equity Net Income – Preferred Dividends AverageStockholders’ Equity = Return on Common Stockholders’ Equity $53,690 – $0 ($180,000 + $234,390) ÷ 2 = = 25.91% Return on Common Stockholders’ Equity This measure indicates how well the company used the owners’ investments to earn income.
Book Value per Share Common Stockholders’ Equity Number of Common Shares Outstanding = Book Value per Share $234,390 27,400 = = $8.55 Book Value Per Share This ratio measures the amount that would be distributed to holders of each share of common stock if all assets were sold at their balance sheet carrying amounts after all creditors were paid off.
Interest rate on borrowed funds Return on investment in assets Positivefinancial leverage > = Interest rate on borrowed funds Return on investment in assets Negative financial leverage < = Financial Leverage Financial leverage involves acquiring assets with borrowed funds.
Financial Leverage = Return on Equity – Return on Assets Financial Leverage Percentage 9.7% = 22.2% – 12.5% Financial leverage is the advantage or disadvantage that occurs as the result of earning a return on equity that is different from the return on assets.
Working Capital The excess of current assets over current liabilities is known as working capital. Working capital is not free. It must be financed with long-term debt and equity.
Current Ratio Current Assets Current Liabilities = Current Ratio $18,000 $12,931 = = 1.39 to 1 Current Ratio This ratio measures the ability of the company to pay current debts as they become due.
Quick Ratio Quick Assets Current Liabilities = Quick Ratio $3,837 $9,554 = = 0.40 to 1 Quick Ratio (Acid Test) This ratio is like the current ratio but measures the company’s immediate ability to pay debts.
Net Credit Sales Average Net Receivables Receivable Turnover = $90,837 ($3,223 + $2,396) ÷ 2 = 32.3 Times = Receivable Turnover Receivable Turnover This ratio measures how quickly a company collects its accounts receivable.
Average Collection Period Days in Year Receivable Turnover = 36532.3 Average Collection Period = 11.3 Days = Average Collection Period This ratio measures the average number of days it takes to collect receivables.
Inventory Turnover Cost of Goods Sold Average Inventory = $61,054 ($12,822 + $11,401) ÷ 2 Inventory Turnover = 5.0 Times = Inventory Turnover This ratio measures how quickly the company sells its inventory.
Average Sale Period Days in Year Inventory Turnover = Average Sale Period 3655.0 = 73 Days = Average Sale Period This ratio measures the average number of days it takes to sell the inventory.
Times Interest Earned Net Interest Income Tax Income Expense Expense Interest Expense + + = Times Interest Earned Tests of solvency measure a company’sability to meet its long-term obligations. Times Interest Earned $5,761 + $392 + $3,547$392 = 24.7 Times = This ratio indicates a margin of protection for creditors.
Debt-to-Equity Ratio Total Liabilities Stockholders’ Equity = Debt-to-Equity Ratio $27,233 $25,030 = = 1.09 Debt-to-Equity Ratio This ratio measures the amount of liabilities that exists for each $1 invested by the owners.