Analyzing Financial Statements
Analyzing Financial Statements. 12.3 in textbook. Types of Financial Statements That we have learned about:. Income Statement- Summarizes the items of revenue and expense and shows the net income (revenue > expense) or net loss (expense > revenue) of a business, for a given FISCAL PERIOD

Analyzing Financial Statements
E N D
Presentation Transcript
Analyzing Financial Statements 12.3 in textbook
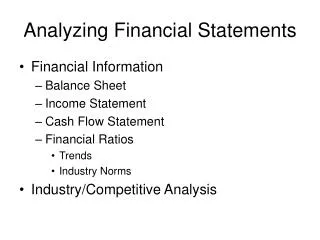
Types of Financial Statements That we have learned about: • Income Statement- Summarizes the items of revenue and expense and shows the net income (revenue > expense) or net loss (expense > revenue) of a business, for a given FISCAL PERIOD • Balance Sheet- statement showing the financial position (assets, liabilities and capital) of an individual, company, or other organization on a CERTAIN DATE.
Used By: Owners- use to evaluate the performance of the people who run the company for them and learn about company activities in general Managers- Use them the most, study them in order to improve results and efficiency, and to eliminate weaknesses. Statements help managers make key business decisions Investors- Shares of public corporations are traded by stockbrokers through stock exchange. Stay informed about the affairs of corporations by reading their financial reports
Used By: Cont. • Creditors- particularly bankers, ask for financial statements regularly. Stay inform about a company’s progress and its ability to meet its loan obligations. (Banks must protect their loans) • Shareholders – law requires that corporations provide shareholders with financial statements regularly. Must be aware of its progress • All use financial statements to evaluate the stability and growth of a business
Why do we need to Analysis Financial Statements? To make it easier to understand meaningful information, comparative, common size and trend analysis may be used Management will attempt to find reason for change The longer the period compared, the better for observing trends
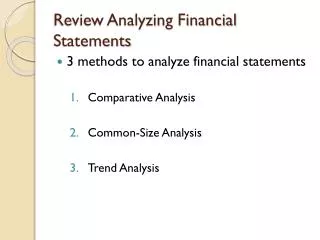
3 Ways to Analysis Data • Comparative Analysis • Common-size Analysis • Trend Analysis
1. Comparative Analysis is… Increasing • When comparing financial statements for two consecutive years • Find the: • A) dollar amount of the increase/decrease from year 1 to year 2
What does the chart tell us? Can indicate the direction of the business; if all numbers are increasing, then there should be an overall increase in company performance However, it is not as useful as percentage change %
Comparative Analysis cont. B) percentage amount of the increase/decrease from year 1 to year 2 Calculate: Percentage Change = Difference/Base Year x100
What can we conclude? Both companies A & B increase by $20 000, however, Company A’s percentage increase is only 7.4% compared to Company B’s percentage increase of 200%
Benefits of Comparative Analysis: • Useful for year to year comparisons showing owner/manager areas to investigate • Indicates whether amounts are within proper range • Percentages can depend on many different factors (ie. Size of market, competition, product etc.)
Let’s Try It! • Exercise #1 p. 584 (t), p. 471 (w)
2. Common-Size Analysis Common-size financial statements are based on a common percentage framework. a) Income Statement- Net Sales (revenue) will represent 100% and all other account balances will be compared to this figure and analyzed
Common-size Analysis Cont. • b) Balance Sheet- • Total Assets will represent 100% and the % of each asset will be compared to this figure • Total Liabilities and Owner’s Equity will represent 100% and liability and owner’s equity figures will be compared to this figure
**Please Note: Data in common-size form can be easily analyzed, not only within one company, but by comparing percentages relative between two companies
Trend Analysis • Trend analysis shows financial data (as figures and percentages) over a number of consecutive periods
Lets consider the following sales figures for a company: • What can you tell me about these figures?
Percentages • Not easy to interpret these figures just by looking at them, but if we change these figures into percentages or a graph, we can easily analyze it
Calculate the percentage change • Comparison Year/Base Year * 100 = Percentage Change
What Can We Conclude? • There was a significant decrease in sales % in year 4, however, by year 6 the company doubled their sales
3 New GAAPs 1. The Consistency Principle: • Requires that a business must use the same accounting methods and procedures from period to period • If there is a change the financial statements must clearly indicate the change • Example: a company records revenue when payments are received, not when invoices are issued. If the company had a bad year, it would be wrong to make the results look better by including some revenue for invoices issued but for which payment has not been received
2. The Materiality Principle: • Requires accountants to follow generally accepted accounting principles except when to do so would be expensive or difficult, and where it makes no real difference if the rules are ignored • Example: invoice error for $50 discovered by company with a net income of approximately $350 000, no effort would be made to correct the error because the $50 is not significant in relation to the net income figure.
3. Full Disclosure Principle: • States that all information needed for a full understanding of the company’s financial affairs must be included in the financial statement • Example: Company being sued for millions, have an impact on the financial standing of the company if they lost the lawsuit. Other examples that might require an accompanying note are tax disputes and company takeovers.
Read p. 567-573 (t) and answer review questions #1-5 p. 583 (t), p. 470 (w) • Ex. 1 & 2 p. 584 (t), p. 471-473 (w) • Ex. 1-3 on the handout