Download

1 / 20
200 likes | 329 Vues
This guide outlines essential methods for analyzing financial statements, including the restatement of balance sheets and use of averages. It covers traditional and capital methods for evaluating current and fixed assets, liabilities, and shareholder equity. Key ratios such as leverage, liquidity, efficiency, and profitability are detailed for measuring a company's financial health. It also introduces value drivers like sales growth and investment rates, providing a well-rounded approach to financial analysis. Ideal for finance professionals and students.

E N D
General Rules • 1) Restate balance sheet to work with capital. • 2) Use averages (current and previous year) for balance sheet items. • 3) Be consistent.
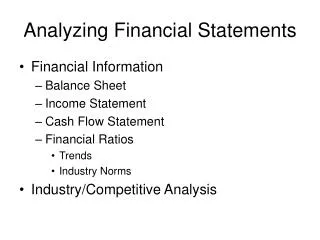
Traditional Method • Current assets • Cash • Receivables • Inventory • Fixed Assets • Net Property Plant and Equipment (NPPE) • Investments • -------------------------------------------------- • Total Assets • --------------------------------------------------
Traditional Method • Current Liabilities • Notes Payable • Accounts Payable • Other Payables • Long Term Liabilities • L.T. Debt • Other Liabilities • Shareholder Equity • -------------------------------------------------- • Total Liabilities and Equity • --------------------------------------------------
Capital Method • Current Assets • Cash • Receivables • Inventory • Less : Operating Current Liabilities • Accounts Payable • Other Payables • -------------------------------------------------- • Operating Working Capital
Capital Method • Operating Working Capital • Fixed Assets • Net Property Plant and Equipment (NPPE) • Investments • -------------------------------------------------- • Total Capital • --------------------------------------------------
Capital Method • Short Term Debt • Notes Payable • Long Term Liabilities • L.T. Debt • Other Liabilities • Shareholder Equity • -------------------------------------------------- • Total Debt and Equity • --------------------------------------------------
Leverage Ratios • Debt Ratio = (Int. Bearing + Leases) / (Capital + Leases) • Debt-Equity Ratio = (Int. Bearing + Leases) / Equity • Times Interest Earned = (EBIT + Depreciation) / Interest • Leverage Ratio = Capital / Equity
Liquidity Ratios • Current Ratio = Current Assets / Current Liabilities • Acid Test Ratio = (Curr Assets – Inv) / Curr Liabs • Working Capital to Assets = Working Capital / Capital
Efficiency Ratios • Total Asset Turnover = Sales / Capital • (TATO) • Sales to W. Capital = Sales / Working Capital • Fixed Asset T/O = Sales / Fixed Assets • Inventory T/O = Cost of Goods Sold / Inventory
Efficiency Ratios • Avg Collection Period = Acc Rec / (Sales / 365) • Avg Payment Period = Acc Payable / (COS / 365) • Inventory Days = 365/(Inv T/O) • Cash Cycle = Inv Days + ACP - APP
Profitability Ratios • Return on Assets (ROA) = Net Pft after Tax / Capital • Return on Equity (ROE) = Net Pft after Tax / Equity • Operating Return on Assets = EBIT / Capital
Profitability Ratios • Net Profit Margin (NPM) = Net Pft after Tax / Sales • Gross Pft Margin (GPM) = Gross Pft / Sales • Expenses to Sales = SGA / Sales
Investment Ratios • Payout Ratio = Divs per Share / Earnings per Share • Retention Ratio = 1 – Payout Ratio • Price–Earnings Ratio (P/E) = Stock Price / EPS • Market to Book Ratio = Stock Price • Book Value per Share
Approaches • Time Series • Cross-section (Comparables -- i.e., Industry or Specific Competitors) • Goals / Targets
Other Methods • Common Size • Balance sheet (as % of capital) • Income statement (as % of sales) • Index Analysis • as % of base year
DuPont Analysis • ROE = Leverage x ROA • ROA = NPM x TATO
Value Drivers • Sales growth • Operating profit margin • Tax rate • Investment rate = [(NPPE + WCAP) / Sales ] • WACC • Competitive advantage period
Value Drivers • ROIC = Net Operating Profit after Tax / Capital • = EBIT (1-T) / Capital • = EBIT (1-T) / Sales x Sales / Capital • = NPM x TATO
Reebok Example • See the Reebok Excel File