Review Analyzing Financial Statements
Review Analyzing Financial Statements. 3 methods to analyze financial statements Comparative Analysis Common-Size Analysis Trend Analysis. Comparative Analysis Comparing financial statements for 2 consecutive years (increase/ decrease) Percentage Change = Difference/ Base Year *100

Review Analyzing Financial Statements
E N D
Presentation Transcript
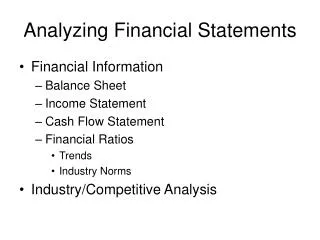
Review Analyzing Financial Statements • 3 methods to analyze financial statements • Comparative Analysis • Common-Size Analysis • Trend Analysis
Comparative Analysis • Comparing financial statements for 2 consecutive years (increase/ decrease) Percentage Change = Difference/ Base Year *100 • Refer to Exercise #1 page 584 (t), page 471(w)
2. Common-Size Analysis • Financial Statements are based on a common percentage • Income statement: Revenue represents 100%, all other accounts will be compared to this figure and analyzed • Balance Sheet: Total Assets represent 100%, the % of each asset will be compared to Total Assets %. Total Liabilities & Owner’s Equity will represent 100% and liability and owner’s equity figures will be compared to Total Liabilities & Owner’s Equity
Common-size Example • Example: Exercise #3 on handout
3. Trend Analysis • Shows financial data (as figures and percentages) over a number of consecutive periods • Exercise #1 on handout
Trend Analysis Example • Example: Exercise 21 on handout
Now that we have worked with percentage changes in comparative, common-size, and trend analysis, let’s apply these changes as ratios and percentages that will help to interpret the financial statements of a business
Define • Solvency: • A company’s ability to pay its debt • Liquidity: • How quickly assets can be converted into cash
Ratios divided into 2 groups • Liquidity or solvency ratios: • Used to decide how easily a company can pay its debts • Profitability ratios: • Used to evaluate a company’s ability to earn profit
* 100 *100 * 100 * 100
Ratio Exercises to be marked • Ex. 7page 607-608 (t) on a blank sheet of paper • Be sure to include the formula, numbers used to calculate the ratio, and a brief explanation of whether the ratio calculation is poor, fair, good, or very good • Part C: Decide whether Pluto Company should proceed with the purchase of Neptune Company and give evidence to support your opinion • Hand-in when completed DUE Friday • Quest Friday Nov. 29
When Done complete the following: • Complete exercises from Friday (back of Friday’s Handout) • Exercise 3a&b, 4a,b,c, and 6a&b p. 277-279 (t), p. 194-198 (w) • Exercise 1,2,3,4 p. 296-299 (t), p. 213-215 (w) • Review questions #1-5 p. 266 (t), p.186 (w), #8-13 p. 275(t), p.192 (w), #1-14 p. 282 (t), p.198 (w)