Download
1 / 55
580 likes | 1.09k Vues
Muscle Factors. Exposure. Countermeasures. Low-Intensity goal-directed training (Aim 2). Motor Neuron Pool. Concomitant training (Aim 3). activation impairment. simulated microgravity. muscle loss.

E N D
Exposure Countermeasures Low-Intensity goal-directed training (Aim 2) Motor Neuron Pool Concomitant training (Aim 3) activation impairment simulated microgravity muscle loss High-Intensity strength training (Aim 1) Muscle Maximal output (strength/power) Submaximal output motor control fatigue Functional Neuromuscular Performance
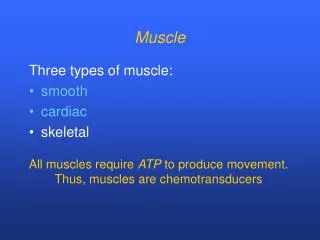
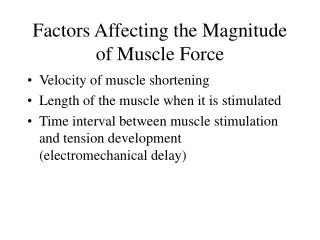
Defining Human Muscular Strength and Power Performance Strength—the maximal force a muscle or muscle group can generate. The capacity to exert force at any given speed. Power—The mathematical product of force (strength) and velocity at whatever speed Muscular endurance—the capacity to sustain repeated muscle actions.
Strength Power and Work • Work= Force x Distance • Power = Work/Time= (Force x Distance)/Time • Velocity= Distance/time • Power = Force x Velocity
Defining Strength • Maximal force at a specified speed (isokinetic): note this is still power • Maximal force at 0 velocity (isometric) • Isotonic: Speed at a set force (power again) • 1 Repetition max: Maximum movable mass (slowest speed, low power)
Human Strength and Power • Biomechanical Factors in Human Strength • Neural Control • Muscle force is greater when: (a) more motor units are involved in a contraction, (b) the motor units are greater in size, or (c) the rate of firing is faster. • Muscle Cross-Sectional Area • The force a muscle can exert is related to its cross-sectional area rather than to its volume. • Arrangement of Muscle Fibers • Variation exists in the arrangement and alignment of sarcomeres in relation to the long axis of the muscle.
Pennation • pennate muscle: A muscle with fibers that align obliquely with the tendon, creating a featherlike arrangement. • angle of pennation: The angle betweenthe muscle fibers and an imaginary line between the muscle’s origin and insertion;0° corresponds to no pennation.
Angle of Pennation • High pennation implies many fibers in parallel to tendon and fewer in series • Pennation increases with shortening • This may allow higher forces esp. at high speeds, extremes of range of motion • May be a disadvantage for eccentric, isometric or low speed contractions (specificity)
Angle of Pennation • The force a muscle can generate can vary from 23-145 PSI of muscle CSA • Pennation can explain some of this variation • Pennation is the oblique arrangement of fibers to tendon or the origin to insertion angle • This can vary as well (between person and muscle) from 0o (no pennation) to 15o • Men tend to have greater pennation (training or genetics?) • Clear training and genetic effects (specificity)
Human Strength and Power • Biomechanical Factors in Human Strength • Muscle Length • At resting length: actin and myosin filaments lie next to each other; maximal number of potential cross-bridge sites are available; the muscle can generate the greatest force. • When stretched: a smaller proportion of the actin and myosin filaments lie next to each other; fewer potential cross-bridge sites are available; the muscle cannot generate as much force. • When contracted: the actin filaments overlap; the number of cross-bridge sites is reduced; there is decreased force generation capability.
Muscle Length and Actin and Myosin Interaction • Figure 4.12 (next slide) • The slide shows the interaction between actin and myosin filaments when the muscle is at its resting length and when it is contracted or stretched. • Muscle force capability is greatest when the muscle is at its resting length because of increased opportunity for actin-myosin cross-bridges.
Human Strength and Power • Biomechanical Factors in Human Strength • Joint Angle • Amount of torque depends on force versus muscle length, leverage, type of exercise, the body joint in question, the muscles used at that joint, and the speed of contraction. • Muscle Contraction Velocity • Nonlinear, but in general, the force capability of muscle declines as the velocity of contraction increases. • Joint Angular Velocity • There are three types of muscle action.
Human Strength and Power • Biomechanical Factors in Human Strength • Strength-to-Mass Ratio • In sprinting and jumping, the ratio directly reflects an athlete’s ability to accelerate his or her body. • In sports involving weight classification, the ratio helps determine when strength is highest relative to that of other athletes in the weight class.
Human Strength and Power • Biomechanical Factors in Human Strength • Body Size • As body size increases, body mass increases more rapidly than does muscle strength. • Given constant body proportions, the smaller athlete has a higher strength-to-mass ratio than does the larger athlete.
w The one-repetition maximum (1RM) is a functional test that is often used to measure strength; it is the maximum weight that can be lifted once. Evaluating Strength
Muscular Endurance w Can be evaluated by noting the number of repetitions you can perform at a given percentage of your 1RM w Is increased through gains in muscular strength w Is increased through changes in local muscular metabolic and circulatory capacity
Power w The functional application of strength and speed w The key component of many athletic performances. w Power = (force x distance)/time, or work/time, or force x velocity w If two individuals can lift the same amount of weight, but one can lift it faster, she is generating more power.
PEAK POWER GENERATED BY FIBERS Power = force x distance time or Power = work/time or Power = force x velocity For fibers of the same size, force production is about the same in type I and II fibers; however, shortening velocity is much higher in type II fibers
Strength of the fiber types The higher force development in type II than in type I motor units is due to more muscle fibers per motor unit and larger size of the individual fibers, not the specific force. In other words, a type I and a type II muscle fiber of the same size will produce the same maximal isometric force. Specific force = force/cross-sectional area The difference in force development between type I and type II motor units is due to the larger number of muscle fibers per motor unit and the larger diameter of the type II fibers.
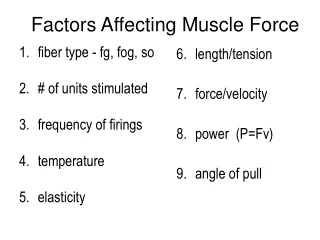
Force Production Influencing Factors • Motor Unit Recruitment • Rate of stimulation of the motor unit (rate coding) • Type of motor units activated (FT or ST) • Preloading • Cross-sectional area (Muscle size) • Velocity of shortening (Speed of muscle action) • Angle of pennation • Initial muscle length (Sarcomere and muscle length) • Shortening or lengthening contractions • Joint angle
Neural Factors Influencing Force Number of motor units activated (recruitment) Rate of stimulation of the motor unit (rate coding) Type of motor units activated (FT or ST)
Frequency of action potentials (rate coding) Brooks et al., Exercise Physiology, 3rd ed., Mayfield, 2000.
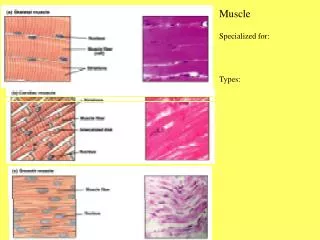
Motor unit size/function Muscles controlling fine movements, such as those controlling the eyes, have a small number of muscle fibers per motor neuron (about 1 neuron for every 15 muscle fibers). Muscles with more general function, such as those controlling the calf muscle in the leg, have many fibers per motor neuron (about 1 neuron for every 2,000 muscle fibers).
Preloading • Isometric force development prior to an action
Cross sectional Area • More fibers in parallel therefore maximal force potential is greater • Muscle volume (and body weight) increase proportionally more than muscle CSA • This explains why smaller athletes are pound for pound stronger (strength to mass ratio) • (Weight lifted)/(body weight 2/3) corrects the CSA/volume relation to normalize strength between body sizes
Velocity of Shortening • More fibers in series (longer muscle) increases potential velocity of shortening • Does this imply that stretching can improve speed, consider the elasticity component? • How about taller individuals? • Variations in tendon insertion can influence shortening velocity as well (between individual variation)
Tendons inserted further away from joint center can generate more force • Tendons inserted closer to the joint center can move the joint faster
Prestretching • This occurs in many sports performance and therefore is important in training • Prestretching increases force of concentric contractions • AKA stretch shortening cycle • This is the basis of plyometric training • Distinguish from preloading
stretch shortening cycle • Two elements that contribute to increased force • Elastic energy: stretching myosin cross bridges and connective tissue • Stretch reflex: Rapid stretch results in activation of this reflex • Stretching a two-joint muscle increases the force at the other joint • Hamstring stronger during knee flexion when hip is flexed vs. extended
What physiological elements contribute to maximal velocity in a sprinter? • How would you train these elements?
Measuring Explosive strength • Index of Explosive strength IES=Fm/Tm • Reactivity coefficient RC=Fm/(Tm·W) w=athletes weight • Force gradient S-gradient=F0.5/T0.5 • A-gradient F0.5/(Tmax-T0.5)