Download
1 / 1
10 likes | 235 Vues
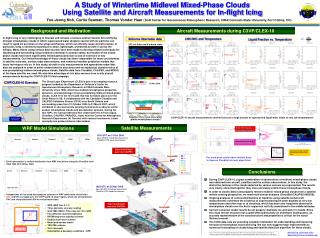
27km. 9km. CloudSat LWC and IWC (2B-CWC-RO). 3km. C3VP/CLEX-10 Target region. Aircraft measurements. LWC/IWC and Temperature. Airborne lidar/radar data. Image: Kevin Strawbridge, EC. 532 nm lidar and Ka-band radar. 1835-1915 UTC. Liquid Fraction vs. Temperature. 05 Nov 2006.

E N D
27km 9km CloudSat LWC and IWC (2B-CWC-RO) 3km C3VP/CLEX-10 Target region Aircraft measurements LWC/IWC and Temperature Airborne lidar/radar data Image: Kevin Strawbridge, EC 532 nm lidar and Ka-band radar 1835-1915 UTC Liquid Fraction vs. Temperature 05 Nov 2006 C3VP/CLEX-10 Target region Supercooled Liquid CARE Ground Site Precipitating Ice Sample CloudSat Ground track Aircraft shows 500 m thin layer of supercooled liquid water, with some ice mixed in • WRF-ARW (Ver. 3.1.1) • Three domains, one way nesting • Grid:199x139x32, Time step (Dt): 20 s (d03) • Five different cloud microphysics • RRTM long-wave radiation scheme • Dudhia short-wave scheme • Noah land-surface model • YSU PBL scheme • 36 hr forecasts • Initialization & boundary conditions : GFS 1810 UTC on 31 Oct 2006 Aqua MODIS: Cloud top temperature CloudSat CPR cloud classification CloudSat shows 1500 m thick layer of supercooled liquid water, with ice near cloud top CloudSat Supercooled liquid layer from CALIPSO Ground-based lidar at CARE site indicates presence of ice virga Supercooled liquid layer from CALIPSO Convair-580 Our work gives useful observational basis to improve CloudSat retrieval algorithms! 40N • Each hydrometeor’s vertical distribution from WRF simulations along the CloudSat track • Valid 1900 UTC 05 Nov 2006 80W 90W Aircraft Morrison Goddard Thompson WSM6 WDM6 Morrison Goddard WDM6 Thompson WSM6 1825 UTC on 05 Nov 2006 Aqua MODIS: Cloud top temperature CloudSat CPR cloud classification CloudSat • Comparisons of five cloud microphysics schemes of WRF model with aircraft data • LWC and IWC averaged over the C3VP/CLEX-10 target region, which are normalized by TWC and interpolated with 500 m vertical resolutions Convair-580 A Study of Wintertime Midlevel Mixed-Phase Clouds Using Satellite and Aircraft Measurements for In-flight Icing Yoo-Jeong Noh, Curtis Seaman, Thomas Vonder Haar (DoD Center for Geosciences/Atmospheric Research, CIRA/Colorado State University, Fort Collins, CO) Aircraft Measurements during C3VP/CLEX-10 Background and Motivation In-flight icing is very challenging to forecast and remains a serious aviation hazard. Aircraft flying through mixed-phase clouds in which supercooled water droplets coexist with ice particles can result in rapid ice accretion on the wings and frames, which can directly cause aircraft crashes. In particular, icing is extremely hazardous to small, lightweight, unmanned aircraft in use by the military. Many efforts using various data sources have been made to develop reliable techniques for identifying and forecasting icing conditions essential in aviation safety, but studies of the mixed-phase clouds have been significantly limited particularly due to lack of extensive in-situ measurements. Our limited knowledge of these clouds has been responsible for many uncertainties in satellite retrievals, surface radar observations, and numerical weather prediction models that these techniques rely on. In this study, aircraft in-situ measurements and spaceborne radar/lidar data are analyzed in order to better understand the structures and microphysical characteristics of non-precipitating midlevel mixed-phase clouds. Satellite data from CloudSat, CALIPSO, and MODIS of the Aqua satellite are used. We also take advantage of rich data sources from in-situ aircraft measurements during the C3VP/CLEX-10 field campaign. The Cloud Layer EXperiment (CLEX) is part of an ongoing research program funded by the Department of Defense's Center for Geosciences/Atmospheric Research at CIRA/Colorado State University since 1996, which has studied microphysical properties, dynamics, and morphology of non-precipitating midlevel mixed-phase clouds. CLEX-10 is the first CLEX that has not taken place over the Great Plains in US. It collaborated with the Canadian CloudSat and CALIPSO Validation Project (C3VP) over South Ontario and surrounding areas from 31 October 2006 to 01 March 2007, which combined in situ and remote sensing instruments to observe winter season mixed-phase clouds and precipitation systems. During the four IOPs, the Convair-580 also flew underneath the A-Train (Aqua, CloudSat, CALIPSO, PARASOL, Aura) near the Centre for Atmospheric Research Experiments (N. Toronto) with various instruments (cloud microphysics probes/airborne lidar/radars). C3VP/CLEX-10 Overview Together they more accurately profile mixed phase clouds! C3VP/CLEX-10 aircraft measurements confirm that such a large amount of supercooled liquid water exists at very low temperatures! Satellite Measurements WRF Model Simulations Conclusions • During C3VP/CLEX-10, a great combination of observations of midlevel mixed-phase clouds was obtained from aircraft, satellites and the surface observations. In this study, the distinctive features of the clouds detected by various sensors are represented. The results very clearly show that together they more accurately profile these mixed phase clouds. • In order to clearly detect and properly retrieve midlevel mixed-phase clouds from a satellite remote sensing perspective, we need multi-sensor analyses (CloudSat+CALIPSO+MODIS). • Ongoing analyses of vertical distributions of liquid/ice using satellite and aircraft measurements confirmed the existence of supercooled liquid water droplets at very low temperatures and often near or at cloud top, which has been also frequently observed in mixed-phase clouds over the Arctic region but not fully understood in the middle-latitudes. • Current numerical model results do not properly distribute ice and water in clouds. Since the cloud vertical structure has a great effect particularly on shortwave heating rates, an accurate representation of the cloud structure and properties is critical for the cloud lifetime forecast. • The CLEX data sets are providing valuable information for understanding and improving forecast of mixed-phase cloud and icing. We can now suggest major improvements to numerical forecasting of clouds/Icing and satellite detection algorithm for these clouds. Noh@cira.colostate.edu Seaman@cira.colostate.edu This research was supported by the Department of Defense Center for Geosciences/Atmopheric Research at Colorado State University under Cooperative Agreement W911NF-06-2-0015 with the Army Research Laboratory.