Download
1 / 19
190 likes | 323 Vues
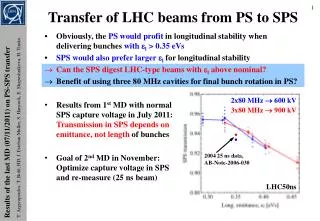
This study delves into the PS to SPS transfer process, detailing earlier transfer studies and ongoing interests. It explores measurements and simulations related to bunch length and intensity, focusing on the trade-offs of larger emittances for longitudinal stability. Methods assessed include bunch splitting and rotation to minimize transfer losses. Key findings indicate that increased SPS voltage at injection may enhance transmission while understanding that the emittance at extraction remains crucial. This work aims to refine the transition methods to improve beam stability and reduce losses.

E N D
PS to SPS Transfer Studies Elena Shaposhnikova, Helga Timkó, Theodoros Argyropoulos, Thomas Bohl, Heiko Damerau, Juan Esteban Müller BE-RF-BR
Outline • Earlier PS to SPS transfer studies • Why we are still interested to continue • Measurement and simulation • Methods • July ‘11 MD: bunch length and transmission as a function of emittance • November ‘11 MD: Tracking the bunch lengths in the PS during splitting and rotation • Conclusions and outlook SPSU-BD Meeting
PS TO SPS TRANSFER: PREVIOUS STUDIES
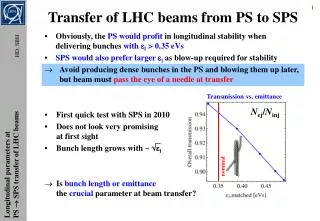
Motivation • Larger emittances in PS (and SPS) are preferable from the longitudinal stability and the delivered intensity point of view, but • Larger εl→ longer τ at ejection → more transfer losses • Bunch ‘gymnastics’ in the PS to SPS transfer: • Starting from (4+2)×3=18 bunches in PS, 10 MHz • Single or double splitting for a 50 ns (20 MHz) or 25 ns (40 MHz) bunch spacing, respectively • Non-adiabatic bunch rotation to shorten the bunch length • Injection to the 200 MHz SPS bucket
Capture losses, 2003/2004 CERN-AB-Note-2004-036 • Matched voltage at injection to SPS: 750 kV • Capture loss vs. capture voltage/intensity was studied • 72 bunches w/ 25 ns spacing, 3-4 batches • τ4σ = 4.2 ns, εl = 0.35 eVs at injection to the SPS • New voltage programme: 2-3 MV injection steps SPSU-BD Meeting
Transfer optimisation, 2008 CERN-AB-Note-2008-021 • Study of the bunch shaping in the PS: bunch rotation with 2 or 3 cavities, i.e. 600 or 900 kV, respectively • The idea behind: higher voltage → more stretched bunches → shorter τ after rotation → less beam losses (?) • Observed: no clear dependence on the rotation voltage • But: a strong dependence of beam loss on intensity Total losses SPSU-BD Meeting
Rotation voltage revisited, July 2011 • Systematic scan of losses vs. bunch length for 600 and 900 kV PS rotation voltage; 50 ns scenario • Transmission doesn’t improve Operational SPSU-BD Meeting
JULY 2011 MD DATA: Comparison with Simulations
Simulation methods (50 ns scenario) • Use the experimentally measured PS FB bunch distribution (sample 500,000 particles) and real PS & SPS voltage programme • STEP 1: Split the initial bunch SPSU-BD Meeting
Simulation methods cont’d (50 ns scenario) • STEP 2: iso-adiabatic bunch shortening • STEP 3: non-adiabatic bunch rotation • STEP 4: injection to SPS bucket N.B. bunch length at ejection is critical! SPSU-BD Meeting
Simulations vs. measurements • In principle, simulations apply the same bunch gymnastics as experiments • However, simulations do not take into account • Intensity • Impedance • Error sources such as synchronisation of RF phases between different harmonics etc. SPSU-BD Meeting
Results • Simulated τ’s are systematically lower, but same trend • Reproduces the earlier finding that higher SPS voltage is better SPSU-BD Meeting
Results cont’d • Introduce a blow-up in simulations to compare τ’sTransmission roughly comparable (N.B. simulation is ‘perfect’) SPSU-BD Meeting
Predicted effect of different voltage programmes • As seen in the ‘08 MD, losses are little affected by VSPS • What counts is ε at injection • εrms = 0.1 eVs (@ rot), • εrms = 0.14 eVs (@ inj) • εrms = 0.08 eVs (@ rot), • εrms = 0.1 eVs (@ inj) • εrms = 0.08 eVs (@ rot), • εrms = 0.09 eVs(@ inj) • εrms = 0.1 eVs (@ rot), • εrms = 0.14 eVs (@ inj) SPSU-BD Meeting
NOVEMBER 2011 MD DATA: TRACKING THE bunch Lengths
The evolution of bunch length in the PS • We then measured τ at different moments in the PS, while taking in parallel tomoscopy data of the initial FB bunch distribution • Losses in SPS (excl. acceler.): ~1.7 % (4.6e12), ~2.8 % (9.2e12) • N.B. very low!! SPSU-BD Meeting
Corresponding simulations • Systematically lower simulated bunch lengths, already from the very beginning SPSU-BD Meeting
Simulation vs. experiments • The ratio of the simulated/experimental bunch lengths shown in the previous table; the experimental emittance is blown-up SPSU-BD Meeting
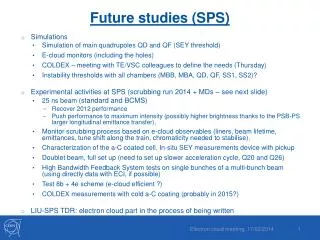
Conclusions and outlook • Transmission was improved over the years but is still an issue if emittance needs to be increased • Increasing the SPS voltage at injection can somewhat improve the transmission, however, • The key factor is the emittance at extraction • ESME simulations reproduce the experimentally observed trends • An emittance blow-up was observed in the PS already before the first splitting • Explanation for simulated bunch lengths being shorter • Work in progress: • Compare with recent MD on 25 ns-scenario transmission • Look for possible reasons of the emittance blow-up SPSU-BD Meeting