Download
1 / 12
120 likes | 227 Vues
This report outlines simulation results and measurements from the MD of 29th March 2012 concerning the optimization of PS bunch rotation timings in collaboration with researchers. It discusses the aim, measurement conditions, results, and the need for further MDs.

E N D
First PS-to-SPS Transfer MD Helga Timkó BE-RF-BR in collaborationwith Theodoros Argyropoulos, Thomas Bohl, Heiko Damerau, Steven Hancock, Juan Esteban Müller, Elena Shaposhnikova
Outline • Reminder of simulation results • Report on the MD of 29th March 2012 • Aim: Optimise the PS bunch rotation timings • Measurement conditions • Results and preliminary conclusions • Why further MDs are needed SPSU-BD Meeting
PS-TO-SPS TRANSFER: WHAT SIMULATIONS PREDICT
Optimising the PSbunch rotation timings • For 1+2 cavities, optimal timing reduces losses: 4.4 % 3.5 % • Using 2+3 cavities instead of 1+2: 3.5 % 1.3 % Transmission can be improved even w/o more voltage SPSU-BD Meeting
Optimised bunch shapes … now improved: tails less populated SPSU-BD Meeting
PS-TO-SPS TRANSFER: WHAT WE MEASURE
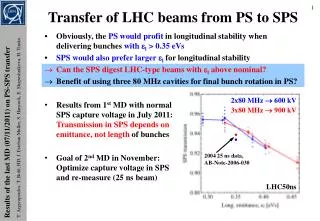
Measurement conditions • Single batch, 25 ns spaced LHC-type beam, 72 bunches • Nominal intensity, 1.1 1011 ppb • In the PS: voltage programme as ‘usual’ • Varying the rotation timings t40 MHz and t80 MHz • In the SPS: FB voltage was 2 MV at injection, then immediately increased to 3 MV (“usual” procedure) • V800 MHz = 0.35 MV In bunch-shortening mode • Bunch length: measured at ejection from the PS with BSM • Cross-checked with bunch length measured at SPS injection • Transmission: logged from “LARGER” at the end of the FB (26 GeV) and at 62 GeV • Cross-checked with BCT data SPSU-BD Meeting
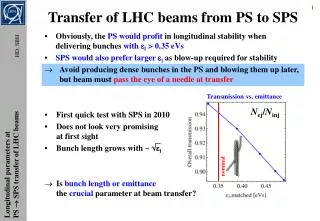
Transmission • The transmission at 62 GeV is the relevant quantity for us, since it includes losses from the acceleration ramp SPSU-BD Meeting
Transmission & bunch length • Better transmission can sometimes require longer bunches Optimum predicted by simulations Currently operational SPSU-BD Meeting
Comparison with simulations • Systematically shorter bunches in this MD than earlier • In (b), we could fit the simulated curve, but also a constant • In (b), higher transmission for t40 MHz = 150 μs than expected • Measurement needs to be repeated Unexpectedly high transmission SPSU-BD Meeting
Comparison with simulations • Simulations predict a maximum ~ t40 MHz = 170-190 μs, t80 MHz = 120 μs • Note: longer bunches, since we took the distributions of a previous MD • Effect is small with the current intensities (order of error bars); need very accurate measurements to verify this SPSU-BD Meeting
Conclusions • The first measurements are encouraging • At least, they don’t contradict the simulations • No conclusive results yet • However, measurements are ‘tricky’ • We’re looking at percent-level differences • We have only percent-level accuracy • Need extremely stable beam conditions and need to ensure that the losses in the transverse plane are constant • Further measurements are planned for the future • Repeat the above & do the same scan with higher voltage SPSU-BD Meeting