Independent Samples T-Test Practice Problem 1a
Independent Samples T-Test Practice Problem 1a.

Independent Samples T-Test Practice Problem 1a
E N D
Presentation Transcript
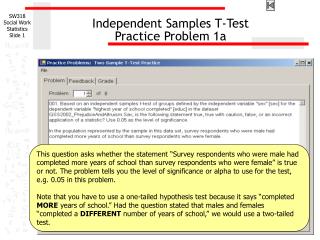
Independent Samples T-Test Practice Problem 1a This question asks whether the statement “Survey respondents who were male had completed more years of school than survey respondents who were female” is true or not. The problem tells you the level of significance or alpha to use for the test, e.g. 0.05 in this problem. Note that you have to use a one-tailed hypothesis test because it says “completed MORE years of school.” Had the question stated that males and females “completed a DIFFERENT number of years of school,” we would use a two-tailed test.
Independent Samples T-Test Practice Problem 1b The problem tells you what statistic to base your answer on, in this case an independent samples t-test. There are other statistics we might have used, and they might even produce a different answer. The independent samples t-test requires that the independent variable be dichotomous and the dependent variable be interval. [sex] is dichotomous level, satisfying the requirement for the independent variable. [educ] is interval level satisfying the requirement for the dependent variable.
Independent Samples T-Test in SPSS (1) The independent samples t-test assumes that the dependent variable is normally distributed. To test this assumption, we will check the skewness and kurtosis for [educ]. Select Analyze > Descriptive Statistics > Descriptives…
Independent Samples T-Test in SPSS (2) Move the dependent variable [educ] to the list box of Variable(s). Click on the Options button to select statistics.
Independent Samples T-Test in SPSS (3) Make certain the check boxes for Kurtosis and Skewness are checked. Click on the Continue button to close the dialog box.
Independent Samples T-Test in SPSS (4) The skewness statistic (-.514) falls in the acceptable range, but the kurtosis statistic (1.899) does not. We cannot satisfy the assumption of normality by the distribution of the variable. However, the assumption of normality can be satisfied for this test by the Central Limit Theorem if both groups in the hypotheses test have 50 or more subjects. We will get the number of subjects in each group defined by the independent variable in the output for the t-test.
Independent Samples T-Test in SPSS (5) This problem can be solved using an independent samples t-test in SPSS. In order to conduct it, go to: Analyze > Compare Means > Independent-Samples T Test…
Independent Samples T-Test in SPSS (6) First, in the Independent-Samples T Test window, select and move the dependent variable [educ] to the “Test Variable(s):” list box and move the independent variable [sex] to the “Grouping Variable:” text box. Second, click on “Define Groups…” button to tell SPSS the code numbers for the groups to substitute for the question marks.
Independent Samples T-Test in SPSS (7) Recall that 1 is the value for male and 2 for female for the variable [sex]. Type these values in the Group 1: and Group 2: text boxes. If you do not recall the code numbers for the groups, look on the Variable View page in the SPSS Data Editor. Click on the Continue button to close the dialog box.
Independent Samples T-Test in SPSS (8) Note that the code values for the independent (Grouping) variable replace the question marks that were after the variable name. Click OK to produce the output.
Independent Samples T-Test in SPSS (9) We still have not satisfied the assumption of normality, so we check the number in each group. There were 291 males and 374 females with valid data. We satisfy the normality assumption with the Central Limit Theorem.
Independent Samples T-Test in SPSS (10) The independent samples t-test assumes that the variance measure of variability is equal for both of the groups included in the t-test. This assumption is tested with Levene's Test for Equality of Variances. The Levene Test is itself a test of the null hypothesis that the variances of the two groups are equal. If we fail to reject the null hypothesis because the p-value or sig. for the statistic is greater than alpha, we satisfy the requirement for equal variances. If we reject the null hypothesis because the p-value or sig. for the statistic is less than or equal to alpha, we do not meet the requirement for equal variances.
Independent Samples T-Test in SPSS (11) If we satisfy the assumption of equal variances, we use the output on the row titled “Equal variances assumed.” If we do not satisfy the assumption of equal variances, we use the output on the row titled “Equal variances not assumed.” This calculation is based on a formula for the t-test that takes into account the differences in variance measures.
Independent Samples T-Test in SPSS (12) In this problem, the probability associated with Levene's Test for Equality of Variances (.021) is less than the level of significance (0.05) stated in the problem. We reject the null hypothesis that the variances are equal, concluding that the “Equal variances not assumed” formula for the independent samples t-test should be used for the analysis.
Independent Samples T-Test in SPSS (13) Having determined which formula for the t-test to base the hypothesis test on, we look to the statistical output for the t-test. The research hypothesis implied by the problem is that the mean "highest year of school completed" [educ] for survey respondents who were male is higher than the mean for survey respondents who were female. This is a one-tailed directional hypothesis. The null hypothesis for this research hypothesis would state that the mean education for males is equal to the mean for females. We make our decision about the null hypothesis by comparing the probability of the test statistic (t) to the alpha level of significance stated in the problem.
Independent Samples T-Test in SPSS (14) SPSS prints out the two-tailed significance and our research hypothesis states a direction to the relationship, requiring us to compute the one-tailed probability. To compute the one-tailed probability, the SPSS 2-tailed significance is divided in half: 0.975 / 2 =0.4875
Independent Samples T-Test in SPSS (15) Since the one-tailed probability of the t statistic (t=.031) was p=0.4875, greater than the alpha of 0.05, the null hypothesis of equal means was not rejected, and we do not have support for the research hypothesis. Based on our analysis, we can not support the statement that “survey respondents who were male had completed more years of school than survey respondents who were female,” so the answer to the question is false.
Independent Samples T-Test Practice Problem 2 This question cannot be answered by an independent samples t-test because the independent samples t-test requires that the independent variable be dichotomous and the dependent variable be interval. [sex] is dichotomous level, satisfying the requirement for the independent variable. However, [marital] is nominal level which does not satisfy the requirement. The answer to the question is incorrect application of a statistic.
Independent Samples T-Test Practice Problem 3 This question can be answered using an independent samples t-test because [sex] is dichotomous level, satisfying the requirement for the independent variable. The dependent variable in the t-test is required to be interval level and [rincom98] is ordinal level. However, we can fall back on the convention of using ordinal variables with interval level statistics, and add a caution to any true findings.
Independent Samples T-Test in SPSS (1) The independent samples t-test assumes that the dependent variable is normally distributed. To test this assumption, we will check the skewness and kurtosis for [rincom88]. Select Analyze > Descriptive Statistics > Descriptives…
Independent Samples T-Test in SPSS (2) Move the dependent variable [rincom98] to the list box of Variable(s). Click on the Options button to select statistics.
Independent Samples T-Test in SPSS (3) Make certain the check boxes for Kurtosis and Skewness are checked. Click on the Continue button to close the dialog box.
Independent Samples T-Test in SPSS (4) [rincom98] satisfied the criteria for a normal distribution. The skewness of the distribution (-.690) was between -1.0 and +1.0 and the kurtosis of the distribution (-.245) was between -1.0 and +1.0.
Independent Samples T-Test in SPSS (5) This problem can be solved using an independent samples t-test in SPSS. In order to conduct it, go to: Analyze > Compare Means > Independent-Samples T Test…
Independent Samples T-Test in SPSS (6) Select and move [rincom98] to Test Variable(s): box and make sure [sex] is still in the Grouping Variable: box and the code numbers for sex are entered. Then, click OK.
Independent Samples T-Test in SPSS (7) The probability associated with Levene's Test for Equality of Variances (.487) is greater than the level of significance (0.05), indicating that the 'Equal variances assumed' formula for the independent samples t-test should be used for the analysis.
Independent Samples T-Test in SPSS (8) The research hypothesis that the average "income" [rincom98] for survey respondents who were male is higher than the average for survey respondents who were female, is a one-tailed directional test. The SPSS 2-tailed significance is divided in half (.000 / 2 =0.0000). Since the probability of the t statistic (t=4.691) was p<0.0001, less than or equal to the alpha of 0.05, the null hypothesis of equal means was rejected and the research hypothesis was supported. When SPSS prints out a probability of 0.000, the number is not equal to zero, but contains zeroes in the first three decimal places. We will correct this by stating it as p<0.001.
Independent Samples T-Test in SPSS (9) To make certain that the relationship stated in the research hypothesis is correct, we compare the means of the two groups to verify that the direction is correctly stated. The research hypothesis stated that males had higher salaries. The mean for males (15.16) is higher than the mean for females (12.68). The comparison is correctly stated in the question. The answer to the problem is true with caution, including the caution because the dependent variable was ordinal.
Steps in solving independent samples t-test problems - 1 The following is a guide to the decision process for answering homework problems about independent samples t-test problems: Is the dependent variable ordinal or interval level and independent variable dichotomous? Incorrect application of a statistic No Yes Compute the skewness, and kurtosis for the variable to test assumption of normality.
Steps in solving independent samples t-test problems - 2 Assumption of normality satisfied? (skew, kurtosis between -1.0 and + 1.0) Yes No Sample size 50+ in each group to apply Central Limit Theorem? No Incorrect application of a statistic Yes Compute the Independent Samples T-Test
Steps in solving independent samples t-test problems - 3 Is the p-value for the Levene’s test for equality of variances <= alpha? Yes No Use Equal variances assumed formula for the t-test. Use Equal variances not assumed formula for the t-test. Is the research hypothesis one-tailed or two-tailed? One-tailed Two-tailed Divide the p-value for the t-test by two.
Steps in solving independent samples t-test problems - 4 No Is the p-value <= alpha? False Yes Comparison of means correctly stated? No False Yes Is the variable ordinal level? No True Yes True with caution