Download
1 / 44
440 likes | 574 Vues
Local Employment Dynamics’ OnTheMap v. 3 All New Information. Colleen D. Flannery Dorothy J. Paugh October 2008. Uses for OnTheMap. Economic Planning & Time Series - Where is the labor supply located? - Which industries are growing or declining over time?

E N D
Local Employment Dynamics’OnTheMap v. 3All New Information Colleen D. Flannery Dorothy J. Paugh October 2008
Usesfor OnTheMap Economic Planning & Time Series - Where is the labor supply located? - Which industries are growing or declining over time? Transportation planning & analysis - Between which areas do workers commute? Emergency management - Daytime population estimates
When there was… …a bridge collapse in Minneapolis, …a proposed plant closure in Missouri, …a hurricane headed for the east coast, …a rash of wild fires in California, …a flood in Iowa What kind of economic information did OnTheMap provide?
Emergency Response Detailed GIS analyses using OnTheMap’s underlying data Potential Economic Impact of Flooding in Des Moines, IA Analyses at the Census Block level of geographical detail
AP: “The flooding in Cedar Rapids swamped 1,300 city blocks, forced 24,000 people to flee their homes…” Analysis uses 1 mile buffer on either side of river
Hurricane Gustav • Work Area Profile Map 2006 • Shows where workers employed in the selection area work • Estimated path of Gustav based on NWS data • Buffer of 50 miles. • Approx. 840,000 jobs in this selection • Each point shows jobs in a single Census Tract
Hurricane Hanna • Work Area Profile Map 2006 • Shows where workers employed in the selection area work • Projected path of Hanna based on NWS data • Plume selection from 20 miles to 150 miles • Approx. 3.9 million jobs in this selection
Local Employment Dynamics (LED) Partnership • Partnership between 50 states and territories • Newest partners = USVI, Puerto Rico • In process of joining = CT • Not in partnership = MA, NH* • Data Sharing • Local knowledge • Comparable data for all states, counties, regions, WIAs • Innovative and Cost-Effective • Uses existing data • Creates new data products *requires legislative change
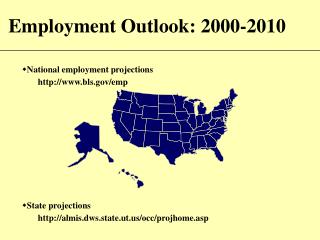
www.census.gov Click on Local Employment Dynamics Or click on Data Tools Or use the url:http://lehd.did.census.gov
New and More PowerfulOnTheMap • Version 1 (2006) • Version 2 (2007) • Version 3 (2008): • 45 States • 5 Years of Data (2002-2006) • New User Interface • Segmented Data (age, income, industry clusters) • Improved Analyses/Maps/Reports
More Advances in OTM Version 3 • Search names (even ZIP codes) • Easier zoom & pan • 4 standard steps for all analyses • New Area Profile map overlays • Better area selection tools • More geographic report choices (“roll ups”) • Animation of point/thermal overlays
5 Steps for Creating OTM Maps and Reports • Define Analytical Question • Search for Name/Pan & Zoom in Map • Turn on/off Geographic Layers & Labels • Create Analysis • View, Save or Print the Map and Report
Selecting Your Basic Geography Type in the name or number of any of the areas shown in the dropdown box.
The Control Panel Map Key = Legend, Scale Layers = Add/Remove Map Features Search = Find Your Area
The Control Panel: Setting Your Choices Analysis = Select Data, Select Area(s), Set Map/Report Type
Step 1. Data Settings • Live or Work Year(s) Job Type Labor Market Segments
Home/Residential Areaor Workplace Area Home Area -- Where workers live Workplace Area -- Where workers work Live or Work limits report options
Where, When, Which, Who Study Area Year Job Type Worker Characteristics
Step 2. Study Area Selection • Select Study Area by: • Layer (City, County, WIA, ZIP Code) • Freehand • Ring/Buffer, etc. • New Features! • Donuts, Plumes • Multiple Selection • Editing of Selection
Freehand Selection and Edit Option New Feature! Modify freehand, buffer, plume, etc.
Step 3: Advanced Area Selection(optional) • Not covered today • However, the selection tools are the SAME as in Step 2 • Allows for: • Paired Areas, or • Complex Modifications to First Area Selection • Note: Paired area selection can change available data items in reports
4. Choosing Map and Report Type Map/Report = Profile of workers in selected area or travel patterns of workers
Key Definitions for Analysis • Area Profile • Shows Work or Home locations within the selection area only. • Shed • Show where workers are going: • Labor Shed shows workers going Home • Commute Shed shows workers going to Work • Display • Points represent each Census Block with jobs • Thermals represent density- average # per square mile
Analysis Type: Labor Shed (Thermals) Where Workers Live who are Employed in Chapel Hill & Carrboro, NC NorthArrow Scale Bar Thermal Key
Labor Shed Report - Reports home location at 3 selected geographic levels (aka, rollups)
Analysis Type: Work Area Profile Where Workers are Employed within Lincoln, NE
Area Profile Report • Area Profile Report • 3 Age categories • 3 Earnings categories • 3 Industry categories • QWI (for Work Areas)
The Results Tab Animate with Points and/or Thermals Legend of Selected Settings Output to HTML, XLS, PDF
Go tohttp://lehd.did.census.gov Go toHelp pages Start Over Make the ControlPanel Appear orDisappear Create a PDFof the MapViewer Get fullURL for analysis Go back tothe previousmap view Clear theoverlays frommap viewer Other Controls
Keep in Mind… • LED not quite national in scope. • LED does not yet include military, self-employed or federal workers. • Data in OnTheMap refreshed annually.
Save the Date • Local Employment Dynamics • Annual Partners Meeting • Washington, DC* • March 5-6, 2009 • *in downtown Washington, DC
Contact Us • Local Employment Dynamics • http://lehd.did.census.gov • Please send your comments to: • CES.Local.Employment.Dynamics@census.gov. • Join the OnTheMap ListServ • lehd-onthemap@lists.census.gov