Download
1 / 53
540 likes | 908 Vues
The History and Politics of Cartography. Elizabeth Hollingsworth. Presentation Outline. Introduction to Maps Ancient mapping Regional maps Medieval maps The age of exploration and cartography The Renaissance and mapping World atlases, the enlightenment, and colonialism

E N D
The History and Politics of Cartography Elizabeth Hollingsworth
Presentation Outline • Introduction to Maps • Ancient mapping • Regional maps • Medieval maps • The age of exploration and cartography • The Renaissance and mapping • World atlases, the enlightenment, and colonialism • Mapping the United States
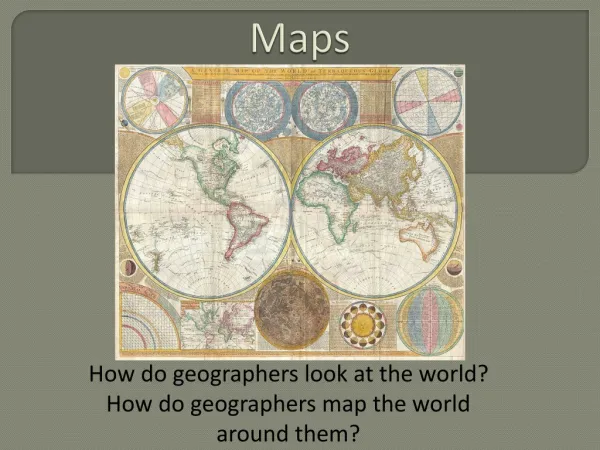
What are maps? • A form of human communication that represent geography and culture • “Map” comes from the Latin mappa, meaning “cloth” • “Maps are pictures of the world that embody changes in artistic depiction, scientific inquiry, and the way we view and understand the land around us. They are material objects, social documents, and historical artefacts. The history of cartography is a complex story of changes in artistic representation, technical progress, and social construction, all of which bear the mark of economic and political power” (11, Short).
Properties of maps: Scale and Projection • Scale is the measure of the compression of a map. • Projection is the representation of the round world on a flat surface. All projections are distortions. • Mercator projection- most famous, used in navigation • Other projections: Robinson, Hammer, Goode, and Sinusoidal
Properties of maps: Orientation • The directionality of a map is its orientation. • Modern orientation places north at the top of the map and south at the bottom. • This is only a recent convention—orientation is subjective in a spherical world. • Using north as the principal orientation point if problematic because of the distinction between “magnetic” north and “true” north. • Orientation reflects people’s judgments and perspectives.
Properties of maps: Symbols, pictures and plans; the grid system • Maps can be represented by symbols, pictures or plans. • A system of vertical and horizontal lines help us structure and represent space in maps. • The most common grid is latitude (north-south) and longitude (east-west).
Maps and GPS • GPS relies on many locating techniques and devices used in maps (ex. longitude and latitude). • GPS would have been impossible without the development of a system of cartography.
Maps carved on rocks • The earliest maps were carved on rocks and they illustrated beliefs and rituals connected with wider cosmologies. • The earliest rock maps were probably made around 40,000 years ago during the upper Paleolithic period.
Kwazulu-Natal rock engraving, southern Africa This rock engraving depicts a hunter with a bow and arrow and his prey. Image from http://www.hp.uab.edu/image_archive/ta/tab.html
The Maps of Hunter-Gatherers • These maps had a practical purpose: to locate fertile areas and good hunting regions. • These maps also had a spiritual purpose: the depictions of animals and places were acts of supplication to the gods. • The maps were drawn on: wood, bark, skins, paddles, canoe seats, clothes, wooden plates, trees, and on the body.
The Agricultural Revolution • The shift from hunting-gathering to agriculture marked a shift in cartography. • Maps focused on field systems and property relations, not on hunting trails and animal habits. • Urban centers developed: “The organized power associated with these hierarchical societies enabled the development of systems of technical knowledge and information recording. The collection of data became an essential part of maintaining social control and political power” (41, Short)
Ancient map of the Mesopotamian world from Sippar, Iraq c 700-500 BC • This map is on a stone tablet. Image from: http://www.thebritishmuseum.ac.uk/compass/ixbin/goto?id=enc383%20
Maps and the Development of Urban Civilization • Urban landscapes became important political and spiritual centers, and were thus rigorously mapped.
Map of Tenochtitlan, Codex Mendoza, c. 1541 Image from http://www.latinamericanstudies.org/aztecs/aztecs24.gif
Maps of South Asia • Few South Asian maps date from more than 800 years ago. • Most pre-European maps from South Asia are cosmological maps that depict the universe. • A hot, humid climate makes it difficult to preserve old maps. • A preoccupation with cosmology contributed to the scarcity of map making.
Ancient Greece • 600 BC: Much intellectual curiosity in Greece. • Pythagoras, Aristarchus, and Eratosthenes concluded that we lived in a heliocentric universe with a spherical earth. Eratosthenes found that the circumference of the earth was 25,000 miles (it is actually 24,899 miles).
Ancient Rome • Julius Caesar initiated a survey of the world to provide geopolitical information about the empire. The “Agrippa Map” resulted. • Ancient Roman maps were used to record landholdings, and were probably used for tax purposes or to assist in the allocation of the water supply.
The Peutinger map, c. 400 AD • This portion of the Peutinger map shows parts of the eastern Mediterranean Image from http://www.livius.org/a/1/judaea/peutinger_jud.jpg
Claudius Ptolemy • Ptolemy’s Guide to Geography described longitude and latitude and proposed this grid system with degrees and minutes. He also outlined a conic and pseudoconic projection. Image from http://www.aces.uiuc.edu/Students/images/C.Ptolemy.jpg
Mappaemundi: 13th-14 c Europe • Maps of the world: Mundus means world • Three types: tripartite, zonal, transitional • Tripartite: most common. These depict Asia at the top, Africa at the east, and Europe at the West. The world is centered at Jerusalem and there is a division of the world by God to the three sons of Noah. • Zonal: divided into 5 or 7 climate zones • Transitional: more accurate, 14th century
The psalter map, c. 1260 Image from http://puffin.creighton.edu/bucko/lectures/images/world.jpg
Portolan Charts and Atlases • These are sea charts from the late 12th century, which developed once mariners started using the compass. • These developed the convention of orientation towards the north. • These have a network of lines that correspond to points of the compass and seafaring routes. • These were error prone because they did not take into account the curvature of the earth.
Portolan chart from the Vallard Atlas, 1547 Image from http://www.mariner.org/captivepassage/photos/lg_inln2001-90_nwafrica.jpg
Islamic Cartography • 800-1400 AD: Arabs conquered much of the Middle East, North Africa, Spain, India and Armenia. The empire was a breeding ground for intellectual activity. • Cosmological maps were created from the Islamic scientific tradition, not religious discourse. • World maps were very general and placed the Middle East at the center
World map, 1456, by Al-Idrisi • This is a very geometric representation of the world. It draws on the Ptolemic understanding, thus combining traditions of the East and the West. Image from http://www.oldmaps.mu/Maps/Images/Al-IdrisiCircular.jpg
Maps of China • Have been dated as early as 200 BC. • During the Tang and Song dynasties, maps were submitted to the central authorities on a 3 to 5 year basis. • In Medieval China, maps were produced by central authorities for military, political, or administrative purposes.
Maps of the Far East • Japan: “Gyoki maps” commissioned by the government. • The Japanese made grid-like maps of rice fields as important records of ownership. • Korea: Ch’onhado maps with Korea at the center of the world. • Korea adopted a more systematic approach to large mapping in the late 15the century in order to aid with defense.
Ch’onhado, Korea, mid 18th century Image from http://www.henry-davis.com/MAPS/Ren/Ren1/750.jpg
Maps of Mesoamerica • Olmecs, Mixtecs, Toltecs, and Zapotecs • Four types of maps: terrestrial with and without a historical narrative, cosmological, and celestial. • Many maps were lost or destroyed during the Spanish conquest.
Maps of South America • 3 types of indigenous mapping: celestial maps, maps made at the behest of Europeans by indigenous people, and maps made by Europeans but influenced by local conceptions of space. • Many maps were quick sketches in the sand or hand gestures in the air.
Alcama, William Hack, 1685 Image from http://www.nmm.ac.uk/collections/images/70/F1904.jpg
Mapping South America • The Spanish and Portuguese did much of the mapping of South America • 1506: the earliest printed map of the New World by Giovanni Matteo Contarini • 1507: Martin Waldseemullewr represented North America as a separate continent • There was not much mapping of the interior of the continent until later
Giovanni Contarini’s world map, 1506 Image from http://www.henry-davis.com/MAPS/Ren/Ren1/308.html
Maps of North America • Few maps pre-European maps of North America exist. • Canadian Inuit maps were engraved onto the ivory tusks of walrus. • Native American made maps on the inside of birch bark. These assisted in navigation along the waterways.
Mapping North America • North America was mapped by the Italians, Dutch, French, and English. • 1612: Map by Samuel de Champlain of France that promoted the idea of colonization.
Map of Virginia, John White, c. 1585 Image from http://www.wilsonsalmanac.com/images1/map_virginia_cr.jpg
Mapping the Pacific • Exploration missions began with Magellan, Francis Drake, and Abel Tasman • The British and the French were competitive over mapping the Pacific in the 18th and 19th centuries.
World map showing Magellan’s voyage, 1544, Battista Agnese Image from http://www.art.com/asp/display_artist-asp/_/crid--33047/Battista_Agnese.htm
The Development of the Sea Atlas • Late 16th century: moderately priced sea atlases were made available. • 1620: Mariner’s Mirror by Lucas Jason Waghenaer was published. This was the first atlas to show sea charts and coastal profiles on the same map.
Ptolemy and the Renaissance • Ptolemy’s Guide to Geography was revised and reprinted all over Europe between 1475 and 1730 • 1524: Cosmographia by Peter Apian first made the distinction between cosmography, geography, and cosmology
Prima Europa Tabula, 1482, from Ptolemy’s Guide to Geography Image from http://images.rgs.org/search_.aspx?keyword=metal
Ptolmey’s world map Image from http://www.sailtexas.com/columbusships.html
Mapping National territories • 1579: The first national atlas of Europe was produced by Christopher Saxton. Saxton also mapped many British regions. • 1611-1612: The first national atlas of Britain was completed by John Speed
Christopher Saxton’s Map of Dorset, c. 1579 Image from http://special.lib.gla.ac.uk/exhibns/month/june2002.html
World Atlases • 1570: Abraham Ortelius’s Theatrum, the first world atlas, was published. • 1595: Mercator’s Atlas was published. This used a map of the world with a Mercator projection.
Map of Russia from Ortelius’s Theatrum Image from http://www.vnbc.dircon.co.uk/OrtelMoscovy.jpg
Mercator’s Arctic, 1595 Image from http://www.helmink.com/Antique_Map_Mercator_Arctic/Scans/Mercator%20Actic%202.jpg
Colonial Mapping: Maps as Imperial Claims • French and British competition for lands in North America is illustrated by their respective cartographies. • 1718: Guillaume Deslisle published a map that compressed the English colonies. • 1755: The British response. Map by John Mitchell extended the boundaries of Virginia, the Carolinas, and Georgia.
Deslisle’s map Image from http://www.plancius.nl/maps/Amerika/images/am4.JPG
Cartography and the Enlightenment • More accurate maps emerged as did an emphasis on latitude and longitude • Urban growth in 18th century Europe prompted large urban mapping projects. Many of these maps were bird’s-eye views of cities.